Question: 3. Find the sample standard deviation (rounded to one decimal place) of the following data set. 3, 1, 11, 19, 18, 8, 16, 6, 16
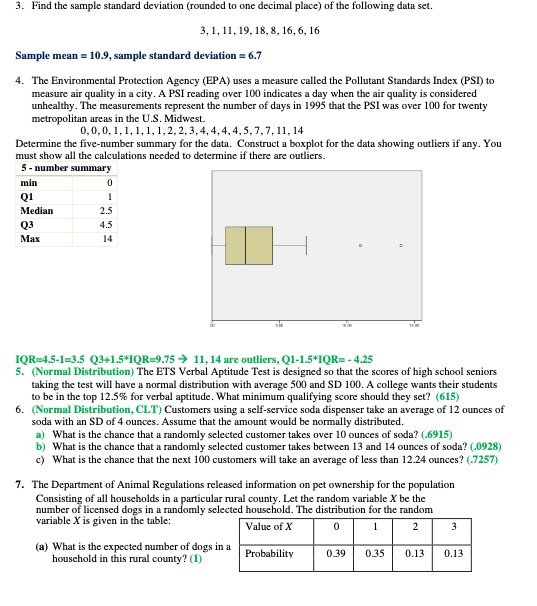
3. Find the sample standard deviation (rounded to one decimal place) of the following data set. 3, 1, 11, 19, 18, 8, 16, 6, 16 Sample mean = 10.9, sample standard deviation = 6.7 4. The Environmental Protection Agency (EPA) uses a measure called the Pollutant Standards Index (PSI) to measure air quality in a city. A PSI reading over 100 indicates a day when the air quality is considered unhealthy. The measurements represent the number of days in 1995 that the PSI was over 100 for twenty metropolitan areas in the U.S. Midwest. 0, 0, 0, 1. 1, 1, 1, 1, 2, 2, 3, 4, 4, 4, 4, 5, 7, 7, 11, 14 Determine the five-number summary for the data. Construct a boxplot for the data showing outliers if any. You must show all the calculations needed to determine if there are outliers. 5 - number summary min Q1 Median 2.5 Q3 4.5 Max 14 IQR=4.5-1-3.5 Q3+1.5*IQR=9.75 > 11, 14 are outliers, Q1-1.5*IQR= - 4.25 5. (Normal Distribution) The ETS Verbal Aptitude Test is designed so that the scores of high school seniors taking the test will have a normal distribution with average 500 and SD 100. A college wants their students to be in the top 12.5% for verbal aptitude. What minimum qualifying score should they set? (615) 6. (Normal Distribution, CLT) Customers using a self-service soda dispenser take an average of 12 ounces of soda with an SD of 4 ounces. Assume that the amount would be normally distributed. a) What is the chance that a randomly selected customer takes over 10 ounces of soda? (.6915) b) What is the chance that a randomly selected customer takes between 13 and 14 ounces of soda? (.0928) c) What is the chance that the next 100 customers will take an average of less than 12.24 ounces? (.7257) 7. The Department of Animal Regulations released information on pet ownership for the population Consisting of all households in a particular rural county. Let the random variable X be the number of licensed dogs in a randomly selected household. The distribution for the random variable X is given in the table: Value of X 2 3 (a) What is the expected number of dogs in a household in this rural county? (1) Probability 0.39 0.35 0.13 0.13