

Question: 3) For the data x = linspace(0,6,20); y 11.40. 1.76, 2.66,4.28, 5.58, 5,98, 7.58, 9.07, 11.33, 10.14, 10.47,10.24, 8.74, 8.70, 6.52, 5.30, 3.51, 3.09, 1.78,
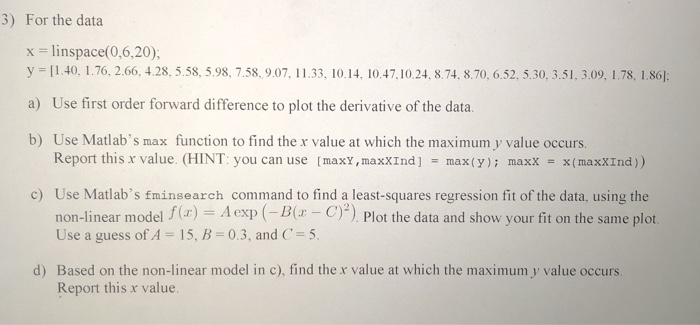
3) For the data x = linspace(0,6,20); y 11.40. 1.76, 2.66,4.28, 5.58, 5,98, 7.58, 9.07, 11.33, 10.14, 10.47,10.24, 8.74, 8.70, 6.52, 5.30, 3.51, 3.09, 1.78, 1.86]: a) Use first order forward difference to plot the derivative of the data. b) Use Matlab's max function to find the x value at which the maximum y value occurs. Report this x value. (HINT: you can use [maxY, maxXInd] max(y)i maxx x(maxxInd)) c) Use Matlab's fminsearch command to find a least-squares regression fit of the data, using the non-linear modelAexp(B(u)) Plot the data and show your fit on the same plot. Use a guess of A 15, B 0.3, and C 5 d) Based on the non-linear model in c), find the r value at which the maximum y value occurs Report this x value 3) For the data x = linspace(0,6,20); y 11.40. 1.76, 2.66,4.28, 5.58, 5,98, 7.58, 9.07, 11.33, 10.14, 10.47,10.24, 8.74, 8.70, 6.52, 5.30, 3.51, 3.09, 1.78, 1.86]: a) Use first order forward difference to plot the derivative of the data. b) Use Matlab's max function to find the x value at which the maximum y value occurs. Report this x value. (HINT: you can use [maxY, maxXInd] max(y)i maxx x(maxxInd)) c) Use Matlab's fminsearch command to find a least-squares regression fit of the data, using the non-linear modelAexp(B(u)) Plot the data and show your fit on the same plot. Use a guess of A 15, B 0.3, and C 5 d) Based on the non-linear model in c), find the r value at which the maximum y value occurs Report this x value
Step by Step Solution
There are 3 Steps involved in it

Get step-by-step solutions from verified subject matter experts