

Question: 3 . Force and length change data are given in the table below for the initial portion of a tension test on AISI 4 1
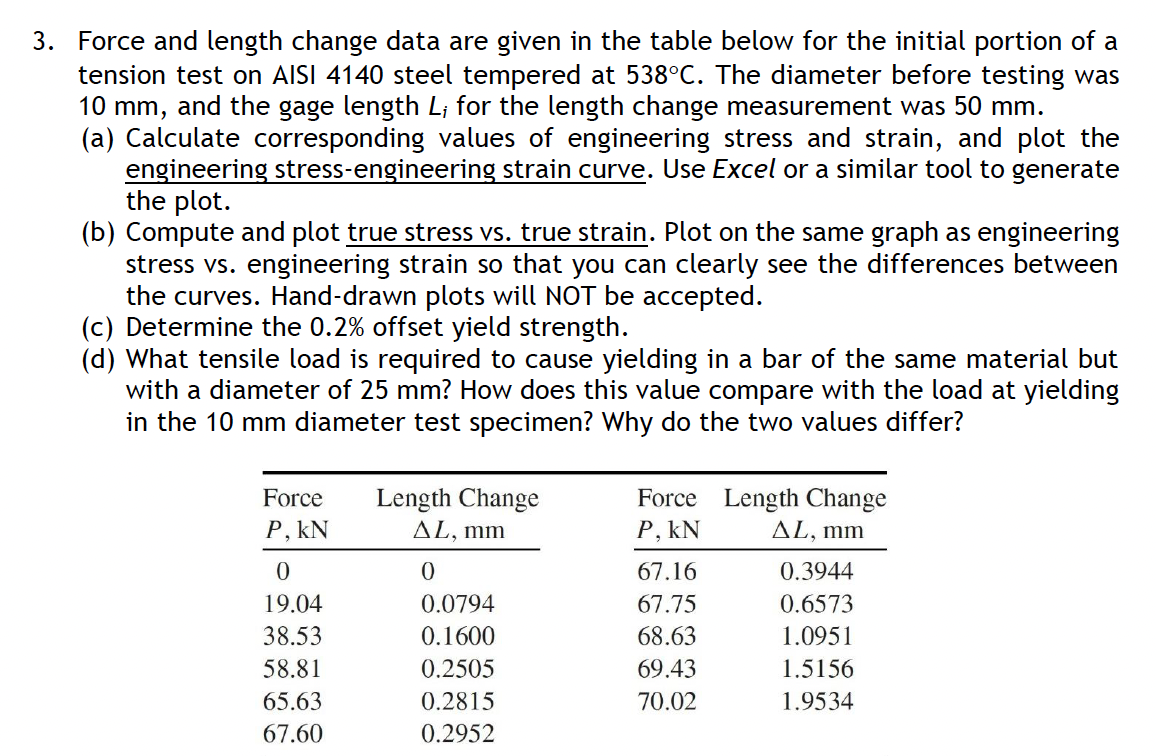
Force and length change data are given in the table below for the initial portion of a tension test on AISI steel tempered at circmathrmC The diameter before testing was mm and the gage length Li for the length change measurement was mm
a Calculate corresponding values of engineering stress and strain, and plot the engineering stressengineering strain curve. Use Excel or a similar tool to generate the plot.
b Compute and plot true stress vs true strain. Plot on the same graph as engineering stress vs engineering strain so that you can clearly see the differences between the curves. Handdrawn plots will NOT be accepted.
c Determine the offset yield strength.
d What tensile load is required to cause yielding in a bar of the same material but with a diameter of mm How does this value compare with the load at yielding in the mm diameter test specimen? Why do the two values differ?
Step by Step Solution
There are 3 Steps involved in it
1 Expert Approved Answer
Step: 1 Unlock

Question Has Been Solved by an Expert!
Get step-by-step solutions from verified subject matter experts
Step: 2 Unlock
Step: 3 Unlock