

Question: 3. Generate a surface plot of the function sin(x)cos( on the black shaded domain illustrated below. Note that the inequality holds true for positions inside
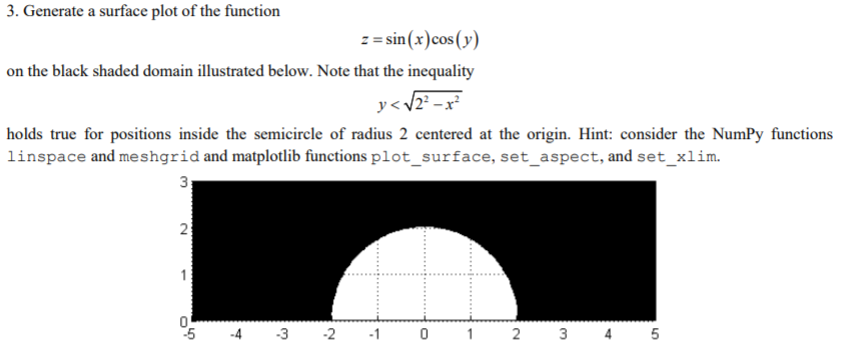
3. Generate a surface plot of the function sin(x)cos( on the black shaded domain illustrated below. Note that the inequality holds true for positions inside the semicircle of radius 2 centered at the origin. Hint: consider the NumPy functions linspace and meshgrid and matplotlib functions plot_surface, set_aspect, and set_xlim 2 5 4 3 - 2 1 1 2 5 3. Generate a surface plot of the function sin(x)cos( on the black shaded domain illustrated below. Note that the inequality holds true for positions inside the semicircle of radius 2 centered at the origin. Hint: consider the NumPy functions linspace and meshgrid and matplotlib functions plot_surface, set_aspect, and set_xlim 2 5 4 3 - 2 1 1 2 5
Step by Step Solution
There are 3 Steps involved in it

Get step-by-step solutions from verified subject matter experts