

Question: 3. Generate graphs for the six Variables a. Generate a Bar Graph for Sex, Motivation, Status, and Education h. Construct a Histograms (distribution plot] with
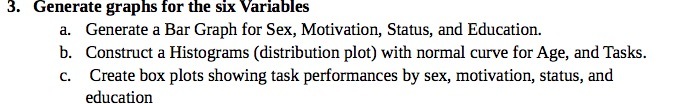
3. Generate graphs for the six Variables a. Generate a Bar Graph for Sex, Motivation, Status, and Education h. Construct a Histograms (distribution plot] with normal curve for Age, and Tasks. c. Create box plots showing task perfonnances by sex, motivation, status, and education
Step by Step Solution
There are 3 Steps involved in it
1 Expert Approved Answer
Step: 1 Unlock

Question Has Been Solved by an Expert!
Get step-by-step solutions from verified subject matter experts
Step: 2 Unlock
Step: 3 Unlock