

Question: 3. Hocking-Pendleton Data. This popular data set was constructed by Hocking and Pendelton (1982) to illustrate influential and outlier observations in regression. The data are
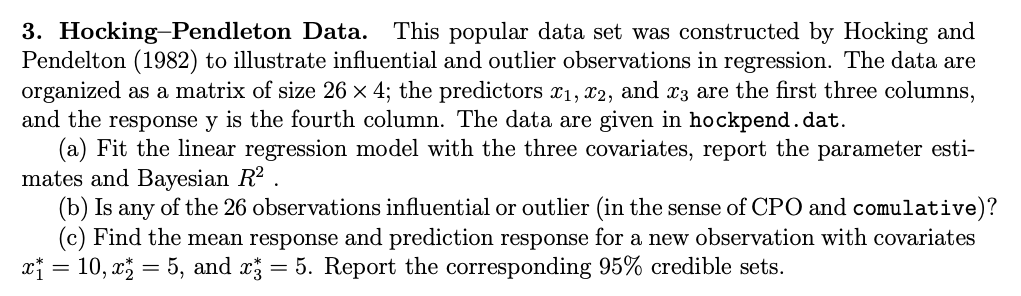
3. Hocking-Pendleton Data. This popular data set was constructed by Hocking and Pendelton (1982) to illustrate influential and outlier observations in regression. The data are organized as a matrix of size 26 4; the predictors x1 , x2 , and x3 are the first three columns, and the response y is the fourth column. The data are given in hockpend.dat.
(a) Fit the linear regression model with the three covariates, report the parameter esti-
2
x?1 = 10, x?2 = 5, and x?3 = 5. Report the corresponding 95% credible sets.
mates and Bayesian R
(b) Is any of the 26 observations influential or outlier (in the sense of CPO and comulative)? (c) Find the mean response and prediction response for a new observation with covariates
3. Hocking-Pendleton Data. This popular data set was constructed by Hocking and Pendelton (1982) to illustrate influential and outlier observations in regression. The data are organized as a matrix of size 26 x 4; the predictors 1, 22, and x3 are the first three columns, and the response y is the fourth column. The data are given in hockpend . dat. (a) Fit the linear regression model with the three covariates, report the parameter esti- mates and Bayesian R2 . (b) Is any of the 26 observations influential or outlier (in the sense of CPO and comulative)? (c) Find the mean response and prediction response for a new observation with covariates x1 = 10, x2 = 5, and x3 = 5. Report the corresponding 95% credible sets
Step by Step Solution
There are 3 Steps involved in it

Get step-by-step solutions from verified subject matter experts