

Question: 3 . How changes in the goods market affect the demand for labor This exercise examines the effect of a bad weather season in Missouri
How changes in the goods market affect the demand for labor
This exercise examines the effect of a bad weather season in Missouri on the price of soybeans in the United States and daily wages of soybean harvesters in Illinois. Assume that buyers of soybeans have no preference for soybean grown in Missouri versus Illinois.
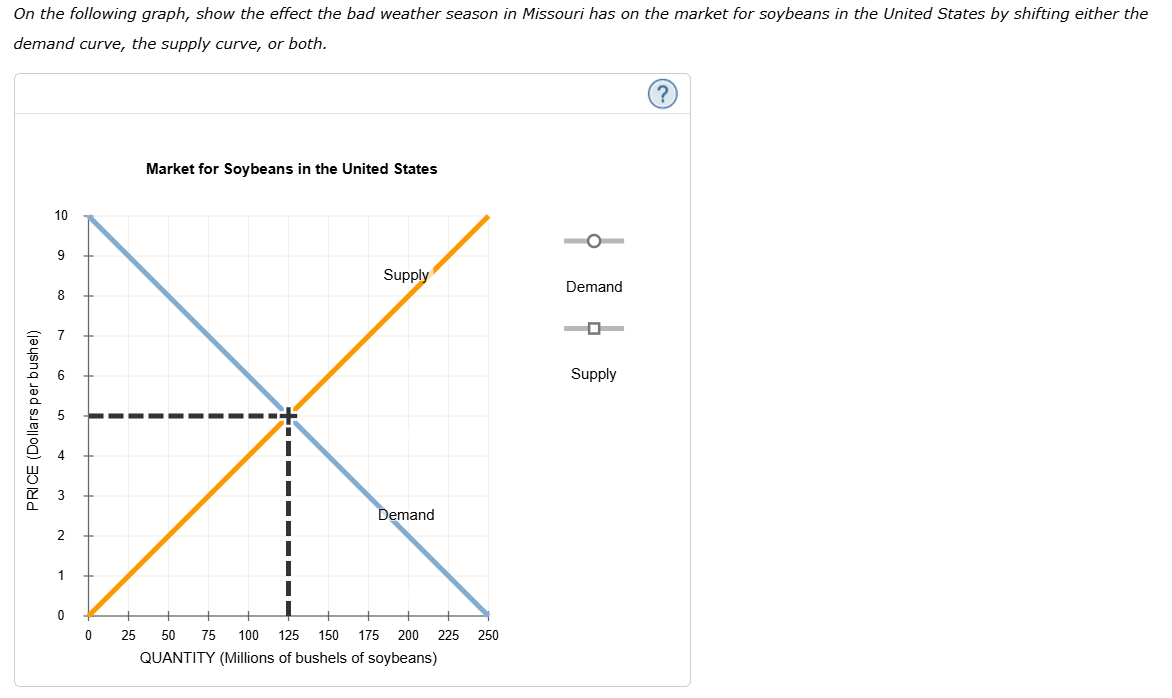
On the following graph, show the effect the bad weather season in Missouri has on the market for soybeans in the United States by shifting either the demand curve, the supply curve, or both.
Market for Soybeans in the United StatesDemandSupplyPRICE Dollars per bushelQUANTITY Millions of bushels of soybeansDemandSupply
Based on the graph for the market for soybeans in the United States, the bad weather season has caused the price of soybeans in the United States to
The following graph shows the daily market for soybean pickers in Illinois.
Show the effect of the change in the price of soybeans in the United States on the market for soybean pickers in Illinois by shifting either the demand curve, the supply curve, or both.
Market for Soybean Pickers in IllinoisDemandSupplyWAGE Dollars per workerLABOR Thousands of workersDemandSupply
As a result of the change in the price of soybeans, the wage level for soybean pickers in Illinois On the following graph, show the effect the bad weather season in Missouri has on the market for soybeans in the United States by shifting either the demand curve, the supply curve, or both.
Market for Soybeans in the United States On the following graph, show the effect the bad weather season in Missouri has on the market for soybeans in the United States by shifting either the demand curve, the supply curve, or both.
Market for Soybeans in the United States
Based on the graph for the market for soybeans in the United States, the bad weather season has caused the price of soybeans in the United States to The following graph shows the daily market for soybean pickers in Illinois.
Show the effect of the change in the price of soybeans in the United States on the market for soybean pickers in Illinois by shifting either the demand curve, the supply curve, or both.
As a result of the change in the price of soybeans, the wage level for soybean pickers in Illinois
Step by Step Solution
There are 3 Steps involved in it
1 Expert Approved Answer
Step: 1 Unlock

Question Has Been Solved by an Expert!
Get step-by-step solutions from verified subject matter experts
Step: 2 Unlock
Step: 3 Unlock