

Question: 3. How did Progressive's average performance during 1995-1999 as an auto insurer compare to those of its key competitors (State Farm, All State, and Geico)?
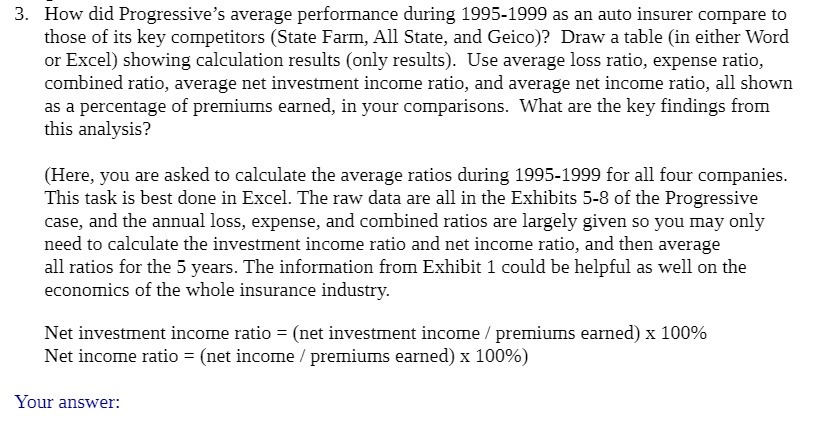
3. How did Progressive's average performance during 1995-1999 as an auto insurer compare to those of its key competitors (State Farm, All State, and Geico)? Draw a table {in either Word or Excel) showing calculation results {only results). Use average loss ratio, expense ratio, combined ratio, average net investment income ratio, and average net income ratio, all shown as a percentage of premiums earned, in your comparisons. 1What are the key ndings from this analysis? (Here, you are asked to calculate the average ratios during 1995-1999 for all four companies. This task is best done in Excel. The raw data are all in the Exhibits 5-3 of the Progressive case, and the annual loss, expense, and combined ratios are largely given so you may only need to calculate the investment income ratio and net income ratio, and then average all ratios for the 5 years. The information from Exhibit 1 could be helpful as well on the economics of the whole insurance industry. Net investment income ratio = [net investment income I premiums earned} x 10D% Net income ratio = {net income f premiums earned) x 100%} Your
Step by Step Solution
There are 3 Steps involved in it

Get step-by-step solutions from verified subject matter experts