

Question: 3. In an experimental study, the temperature is increased by 2C between 20 C and 100C, and the pressure is increased by 25 Pa between
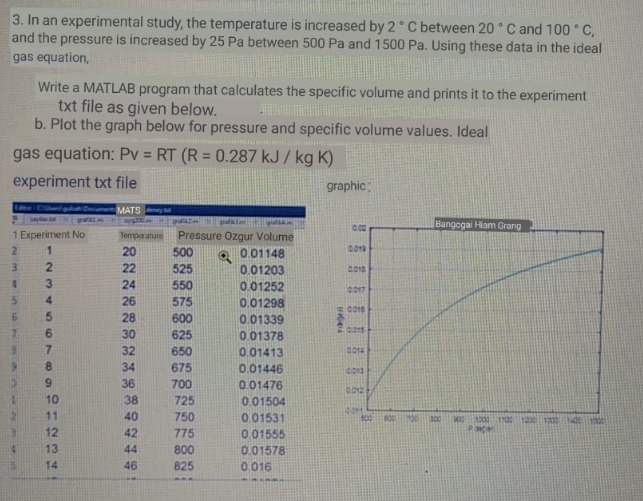
3. In an experimental study, the temperature is increased by 2C between 20 C and 100C, and the pressure is increased by 25 Pa between 500 Pa and 1500 Pa. Using these data in the ideal gas equation, Write a MATLAB program that calculates the specific volume and prints it to the experiment txt file as given below. b. Plot the graph below for pressure and specific volume values. Ideal gas equation: PV = RT (R = 0.287 kJ / kg K) experiment txt file graphic MATS Bangogai Hiam Grang 0010 0015 1 Experiment No 2 1 2 3 5 4 5 5 7 6 7 8 9 10 11 12 13 14 Temperature Pressure Ozgur Volume 20 500 0.01148 22 525 0.01203 24 550 0.01252 26 575 0.01298 28 600 0.01339 30 625 0.01378 32 650 0.01413 34 675 0.01446 36 700 0.01476 38 725 0.01504 40 750 0.01531 42 775 0.01555 44 800 0.01578 46 825 0.016 000 0012 90 1
Step by Step Solution
There are 3 Steps involved in it

Get step-by-step solutions from verified subject matter experts