

Question: 3) In data file utility.xls are the average utility bills for homes of a particular size (Y) and the average monthly temperature (X). Use
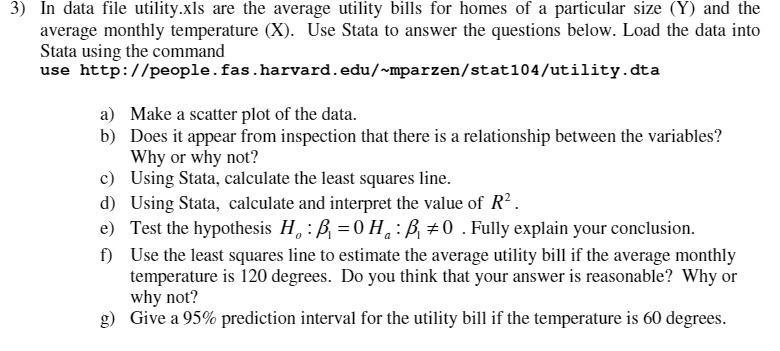
3) In data file utility.xls are the average utility bills for homes of a particular size (Y) and the average monthly temperature (X). Use Stata to answer the questions below. Load the data into Stata using the command use http://people. fas.harvard.edu/~mparzen/stat 104/utility.dta a) Make a scatter plot of the data. b) Does it appear from inspection that there is a relationship between the variables? Why or why not? c) Using Stata, calculate the least squares line. d) Using Stata, calculate and interpret the value of R. e) Test the hypothesis H. B=0H: B0. Fully explain your conclusion. f) Use the least squares line to estimate the average utility bill if the average monthly temperature is 120 degrees. Do you think that your answer is reasonable? Why or why not? g) Give a 95% prediction interval for the utility bill if the temperature is 60 degrees.
Step by Step Solution
There are 3 Steps involved in it

Get step-by-step solutions from verified subject matter experts