

Question: 3. in r code Use the ALL dataset - should be found using library(multtest) library(ALL) data (ALL) and create the following plot. (Hint: Use the
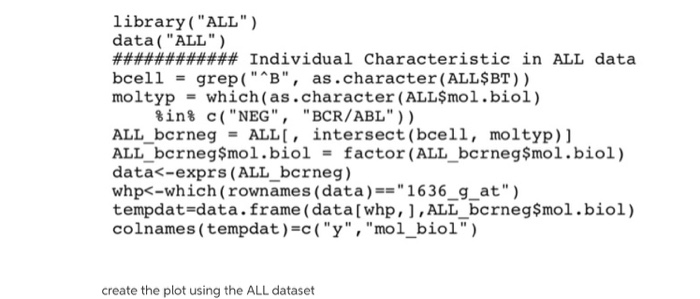
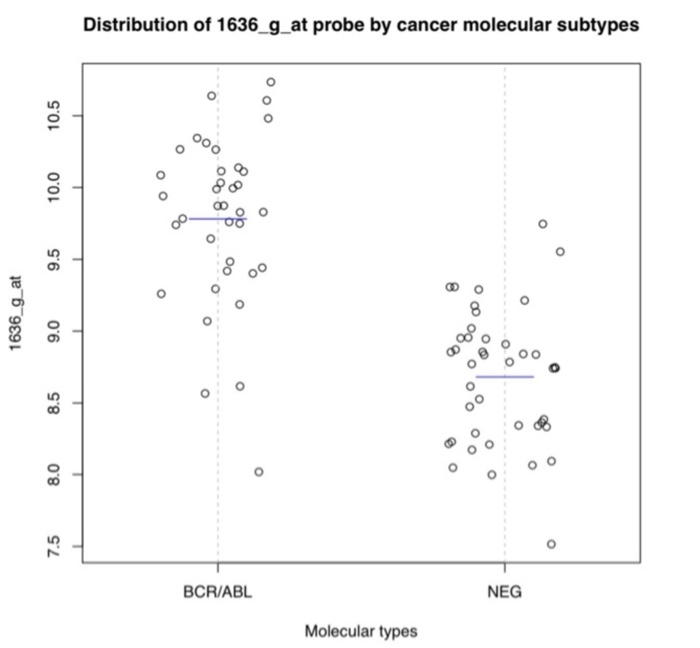
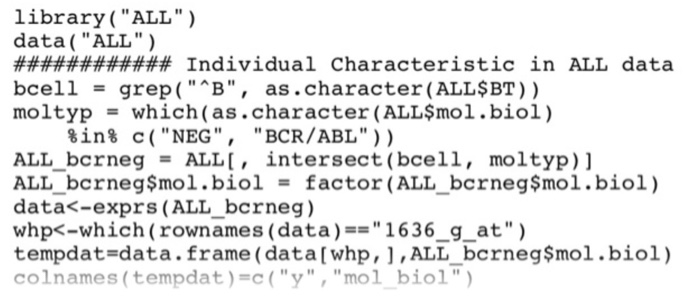
3. in r code Use the ALL dataset - should be found using library(multtest) library(ALL) data (ALL) and create the following plot. (Hint: Use the attached R code to access expression d jitter=0.2, vertical=T, ylab...,main=...). Use ylab to label y-axis correctly and main to create a main title. For the blue lines indicating means in each group, use lines (c(x1,x2), cly1.y2), col=4) where x1, x2, y1, y2 are the locations of the line in x-axis and y-axis respectively Distribution of 1636_g_at probe by cancer molecular subtypes 10.5 10.0 9.5 1636_g_at 9.0 of 000 8.5 8.0 7.5 BCR/ABL NEG Molecular types library("ALL") data("ALL") ############ Individual Characteristic in ALL data bcell = grep ("AB", as.character (ALLSBT)) moltyp - which(as.character (ALL$mol.biol) kins ("NEG", "BCR/ABL")) ALL bcrneg = ALL, intersect(bcell, moltyp) ] ALL_bcrneg$mol.biol = factor (ALL bcrneg$mol.biol) data
Step by Step Solution
There are 3 Steps involved in it

Get step-by-step solutions from verified subject matter experts