

Question: 3. In science class, Timothy collects data on the relationship between temperature and pressure for a gas that Is heated in a closed container. Temperature
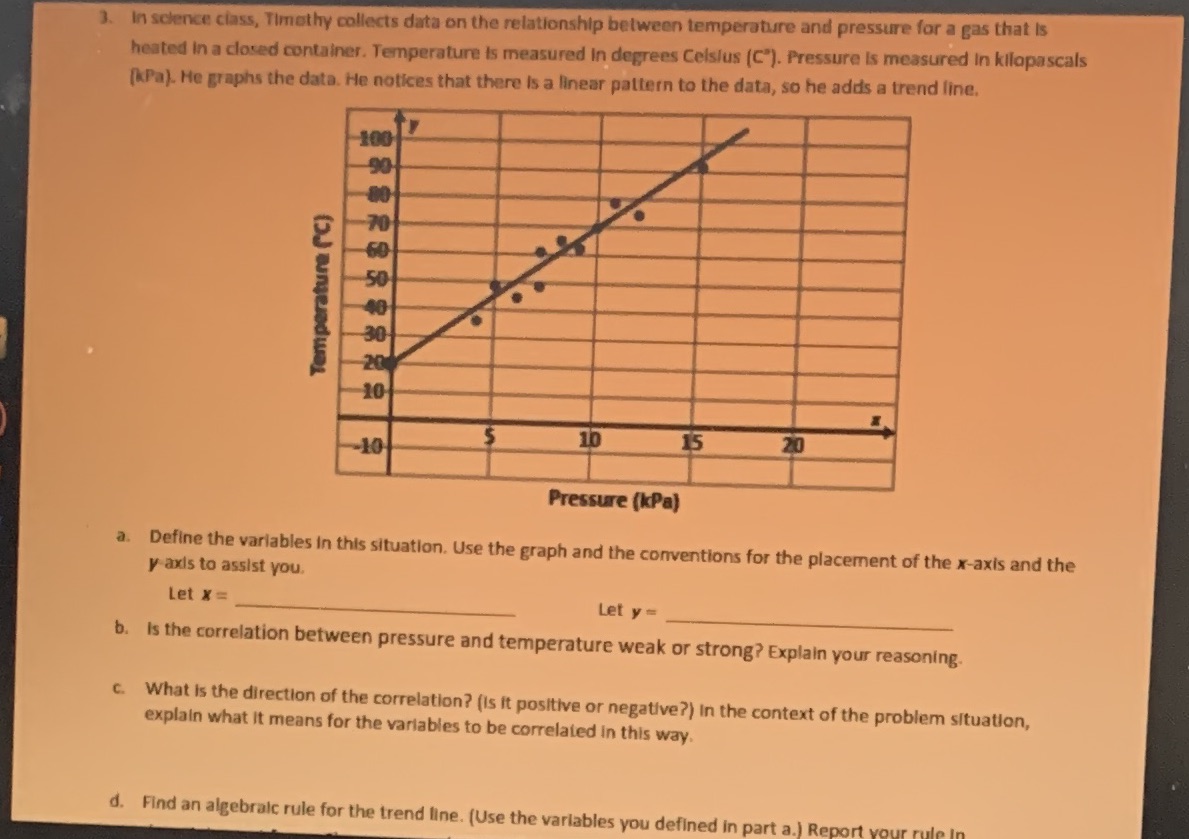
3. In science class, Timothy collects data on the relationship between temperature and pressure for a gas that Is heated in a closed container. Temperature is measured In degrees Celsius (C"). Pressure Is measured In kilopascals [kPa). He graphs the data. He notices that there Is a linear pattern to the data, so he adds a trend line. 100 90 Temperature (C) 10 15 20 10 Pressure (kPa) a. Define the variables in this situation. Use the graph and the conventions for the placement of the x-axis and the y axis to assist you. Let X = Let y = b. Is the correlation between pressure and temperature weak or strong? Explain your reasoning. c. What is the direction of the correlation? (Is it positive or negative?) In the context of the problem situation, explain what it means for the variables to be correlated in this way. d. Find an algebraic rule for the trend line. (Use the variables you defined in part a.) Report
Step by Step Solution
There are 3 Steps involved in it

Get step-by-step solutions from verified subject matter experts