

Question: 3. In the below you have been provided with plots of the time series of Tomato Prices (Per KG) used in the Consumer Prices
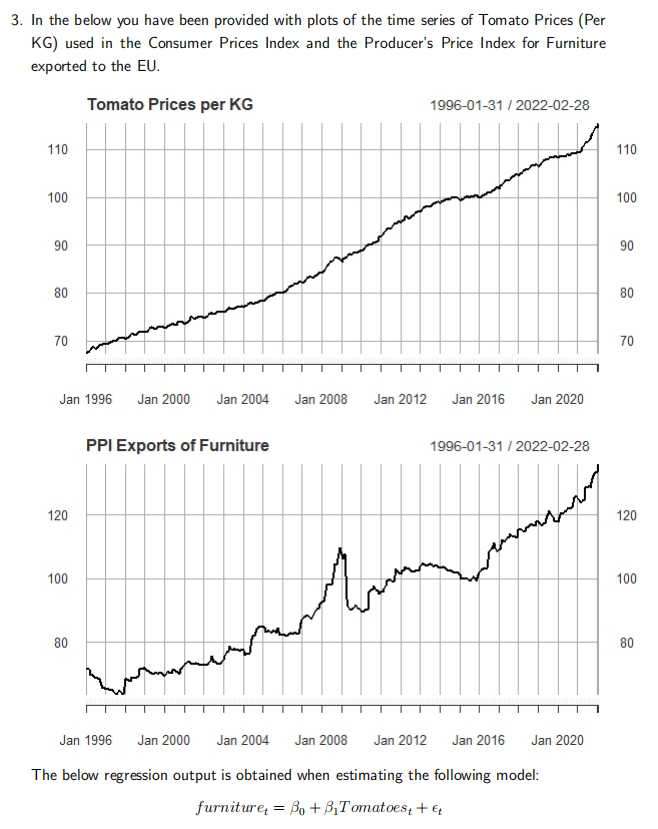
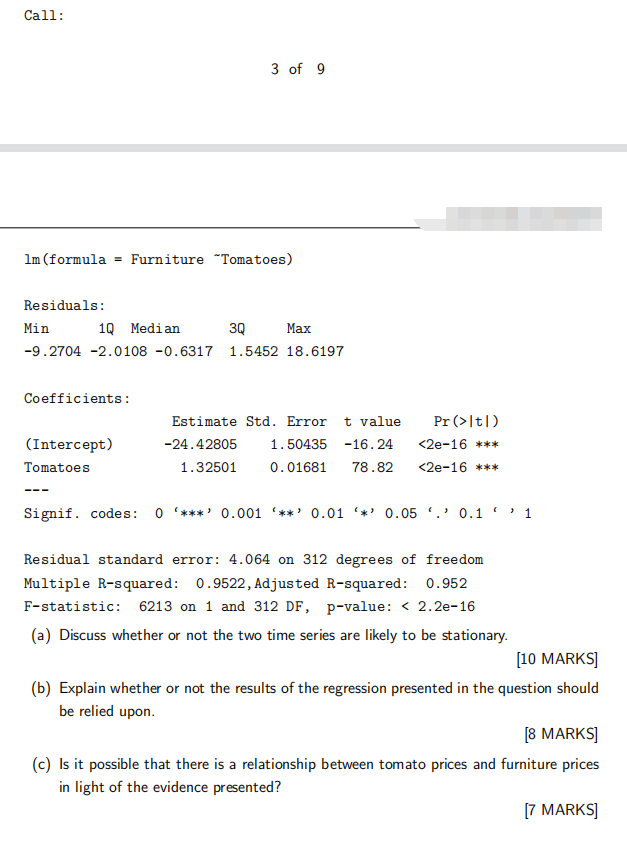
3. In the below you have been provided with plots of the time series of Tomato Prices (Per KG) used in the Consumer Prices Index and the Producer's Price Index for Furniture exported to the EU. Tomato Prices per KG 1996-01-31/2022-02-28 110 100 90 90 80 70 10 Jan 1996 Jan 2000 Jan 2004 Jan 2008 Jan 2012 PPI Exports of Furniture 10 120 100 80 60 110 10 100 100 90 90 80 Jan 2016 Jan 2020 70 70 1996-01-31/2022-02-28 120 100 00 80 60 Jan 1996 Jan 2000 Jan 2004 Jan 2008 Jan 2012 Jan 2016 Jan 2020 The below regression output is obtained when estimating the following model: furniture = Bo+ BTomatoes+ + &
Step by Step Solution
There are 3 Steps involved in it

Get step-by-step solutions from verified subject matter experts