

Question: 3) Locate the data for the numerator and denominator using the page 3 Financial Summary of the CAPSIM Round 0 FastTrack report that is provided.
3) Locate the data for the numerator and denominator using the page 3 Financial Summary of the CAPSIM Round 0 FastTrack report that is provided.
4) Input the required financial data into the appropriate "Blue" cells within the spreadsheet. Next input the Excel calculation required to calculate the financial measure, return or ratio in the "Yellow" cells of the spreadsheet.
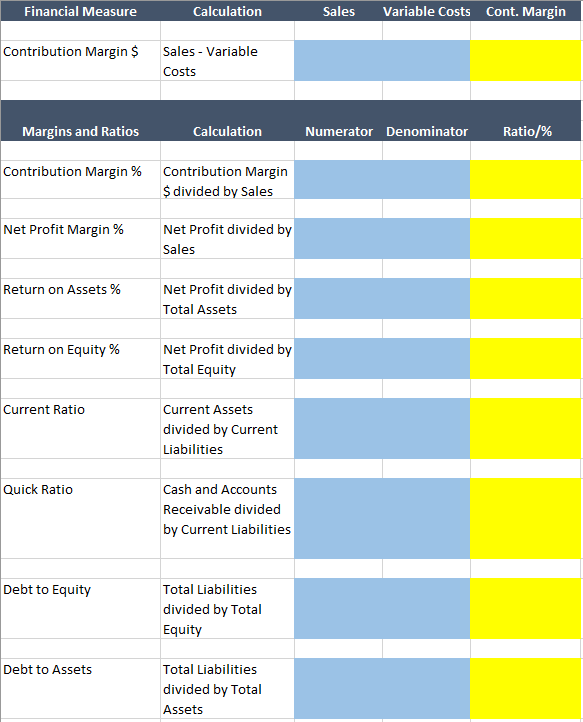
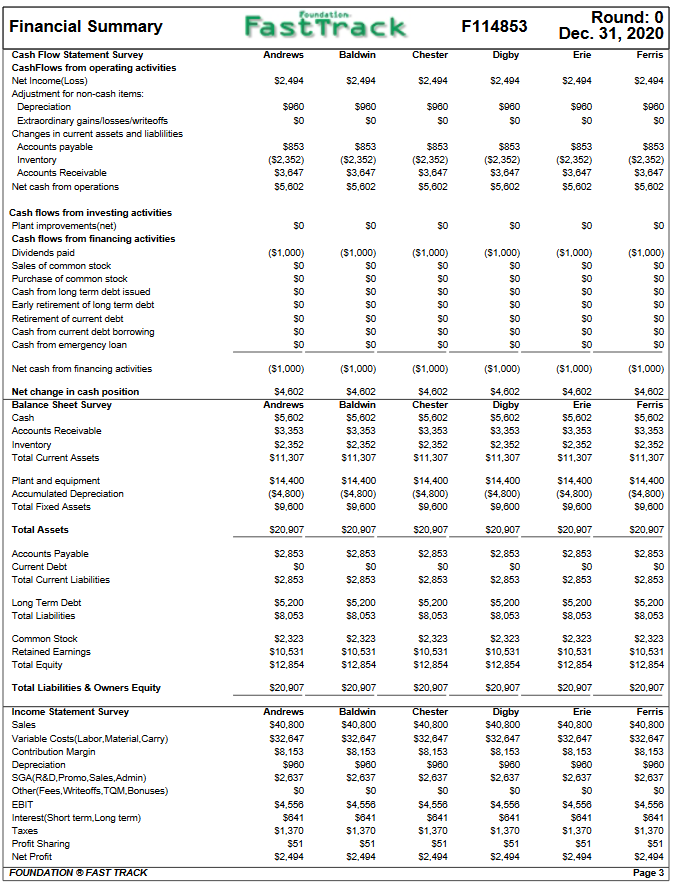
Financial Measure Calculation Sales Variable Costs Cont. Margin Contribution Margin $ Sales - Variable Costs Margins and Ratios Calculation Numerator Denominator Ratio/% Contribution Margin % Contribution Margin $ divided by Sales Net Profit Margin % Net Profit divided by Sales Return on Assets % Net Profit divided by Total Assets Return on Equity % Net Profit divided by Total Equity Current Ratio Current Assets divided by Current Liabilities Quick Ratio Cash and Accounts Receivable divided by Current Liabilities Debt to Equity Total Liabilities divided by Total Equity Debt to Assets Total Liabilities divided by Total Assets Foundation Financial Summary Fast Track F114853 Round: 0 Dec. 31, 2020 Andrews Baldwin Chester Digby Erie Ferris $2,494 $2,494 $2,494 $2,494 $2,494 $2,494 Cash Flow Statement Survey CashFlows from operating activities Net Income(Loss) Adjustment for non-cash items: Depreciation Extraordinary gains/losses/writeoffs Changes in current assets and liablilities Accounts payable Inventory Accounts Receivable Net cash from operations $960 SO $960 SO $960 SO $960 SO $960 SO $960 SO $853 (52,352) $3,647 $5,602 $853 (52,352) $3,647 $5,602 $853 (52,352) $3,647 $5.802 $853 ($2,352) $3,647 $5.802 $853 ($2,352) $3,647 $5,602 $853 ($2,352) $3,647 $5.802 SO SO SO SO SO SO Cash flows from investing activities Plant improvements(net) Cash flows from financing activities Dividends paid Sales of common stock Purchase of common stock Cash from long term debt issued Early retirement of long term debt Retirement of current debt Cash from current debt borrowing Cash from emergency loan Net cash from financing activities ($1,000) SO SO SO SO SO SO SO ($1,000) SO SO SO SO SO SO SO ($1.000) SO So SO SO SO SO SO ($1.000) SO So SO SO SO SO SO ($1.000) SO So SO SO SO SO SO ($1,000) SO SO SO SO SO SO SO ($1.000) ($1.000) ($1.000) ($1,000) ($1,000) ($1.000) Net change in cash position Balance Sheet Survey Cash Accounts Receivable Inventory Total Current Assets Plant and equipment Accumulated Depreciation Total Fixed Assets $4,602 Andrews $5.802 $3.353 $2,352 $11,307 $4,602 Baldwin $5,602 $3,353 $2,352 $11,307 $4,602 Chester $5,602 $3,353 $2,352 $11,307 $4,802 Digby $5,602 $3,353 $2,352 $11,307 $4,602 Erie $5.802 $3,353 $2,352 $11,307 $4,602 Ferris $5,602 $3,353 $2,352 $11,307 $14,400 ($4,800) $9,800 $14.400 (S4,800) $9,600 $14.400 (S4,800) S9,600 $14,400 (54,800) $9,800 $14,400 (S4,800) $9,800 $14,400 (54,800) $9,600 Total Assets $20,907 $20,907 $20,907 $20,907 $20,907 $20,907 $2,853 SO $2,853 $2,853 SO $2,853 $2.853 SO $2,853 $2.853 SO $2,853 $2.853 SO $2,853 $2,853 SO $2,853 Accounts Payable Current Debt Total Current Liabilities Long Term Debt Total Liabilities $5.200 $8.053 $5.200 $8.053 $5,200 $8,053 $5,200 $8,053 $5,200 $8,053 $5,200 $8.053 Common Stock Retained Earnings Total Equity $2.323 $10,531 $12,854 $2.323 $10,531 $12,854 $2.323 $10,531 $12,854 $2.323 $10,531 $12,854 $2.323 $10,531 $12,854 $2.323 $10,531 $12,854 Total Liabilities & Owners Equity $20,907 $20,907 $20,907 $20,907 $20,907 $20,907 Income Statement Survey Sales Variable Costs(Labor, Material. Carry) Contribution Margin Depreciation SGA(R&D Promo, Sales, Admin) Other(Fees, Writeoffs. TQM.Bonuses) EBIT Interest(Short term. Long term) Taxes Profit Sharing Net Profit FOUNDATION FAST TRACK Andrews $40.800 $32,647 $8,153 $900 $2,637 SO $4,558 $841 $1,370 $51 $2,494 Baldwin S40.800 $32,647 $8,153 $960 $2,637 SO $4.556 $841 $1,370 $51 $2,494 Chester $40.800 S32,647 $8,153 $900 $2,637 SO $4,558 $641 $1.370 $51 $2,494 Digby $40.800 $32,647 $8,153 $960 $2,637 SO $4,558 $841 $1,370 $51 $2,494 Erie $40.800 $32,647 $8,153 $960 $2,637 SO $4,558 $841 $1,370 $51 $2,494 Ferris $40.800 $32,647 $8,153 $960 $2,637 SO $4,556 $841 $1,370 $51 $2,494 Page 3
Step by Step Solution
There are 3 Steps involved in it

Get step-by-step solutions from verified subject matter experts