

Question: 3 math statistics questions The table below describes the smoking habits of a group of asthma sufferers. If one of the 1156 people is randomly

3 math statistics questions


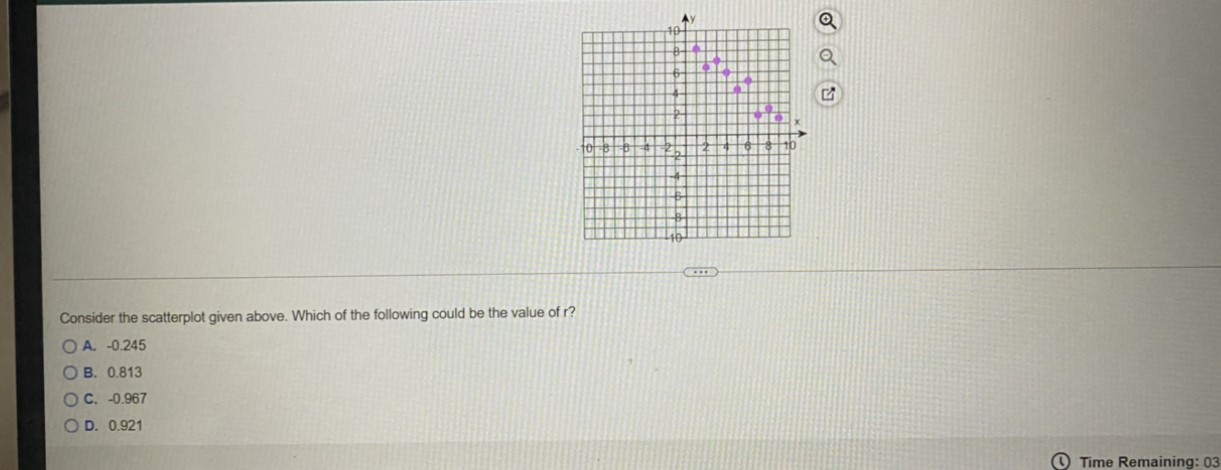
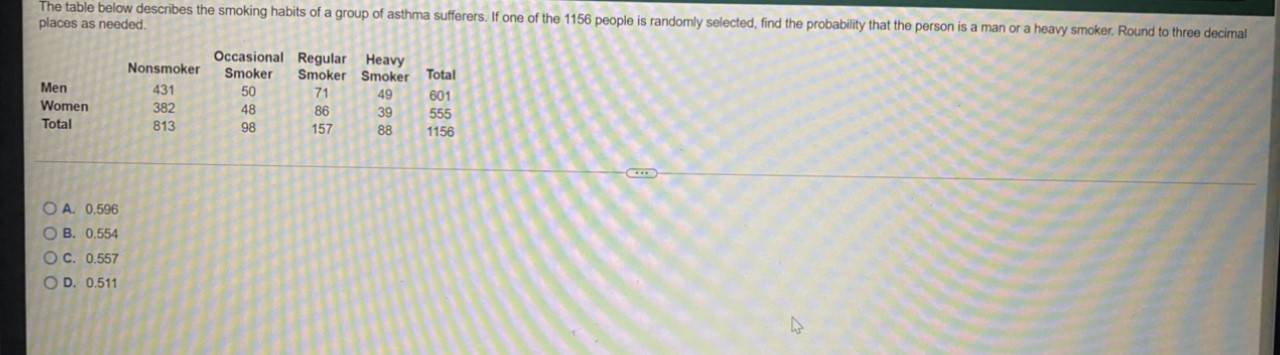
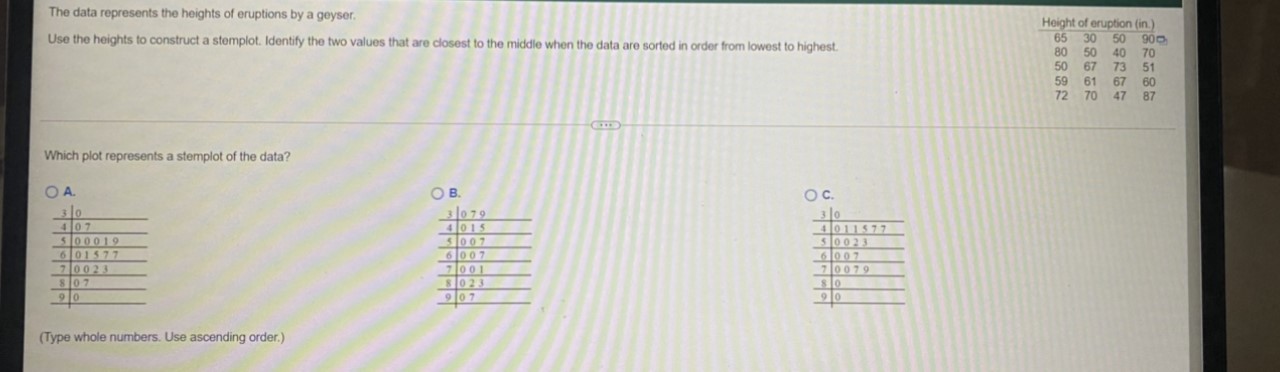
The table below describes the smoking habits of a group of asthma sufferers. If one of the 1156 people is randomly selected, find the probability that the person is a man or a heavy smoker. Round to three decimal places as needed. Occasional Regular Heavy Nonsmoker Smoker Smoker Smoker Total Men 431 50 71 49 601 Women 382 48 86 39 555 Total 813 98 157 88 1156 O A. 0.596 O B. 0.554 O C. 0.557 OD. 0.511The data represents the heights of eruptions by a geyser. Height of eruption (in.) Use the heights to construct a stemplot. Identify the two values that are closest to the middle when the data are sorted in order from lowest to highest 30 50 90 40 70 N858 8 67 73 51 61 67 60 70 47 87 Which plot represents a stemplot of the data? O A. O B. O c. 30 3/079 310 4 07 4015 4 01 1577 5 00019 50 07 5 0023 6 01577 6 007 6 007 70023 7001 70079 807 8 023 910 907 90 (Type whole numbers. Use ascending order.)Consider the scatterplot given above. Which of the following could be the value of r? O A. -0.245 O B. 0.813 O C. -0.967 OD. 0.921 Time Remaining: 03
Step by Step Solution
There are 3 Steps involved in it

Get step-by-step solutions from verified subject matter experts