

Question: 3. Model 2 uses a different DV to measure the same DV, Bias severity, but is otherwise quite similar to Model 1. A good way
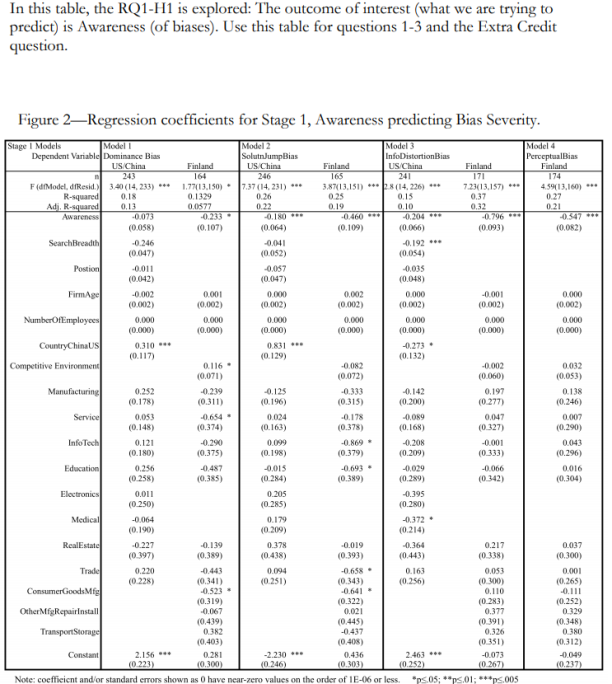
3. Model 2 uses a different DV to measure the same DV, Bias severity, but is otherwise quite similar to Model 1. A good way to see if a theory is supported is when you get statistically significant coefficients for more than way of measuring the outcome (DV). This is why Model 2 uses a different DV than Model 1. If both of our hypothesized relationships are supported by the analysis (coefficients are significant) this adds support to the argument that our hypothesis is true, and is highly desirable.
In Model 2, is awareness a significant predictor of bias severity? If yes, what are the coefficient magnitudes, signs and significance levels for each region (US/Finland and China)?
What does this finding mean? Again, explain this in one paragraph.
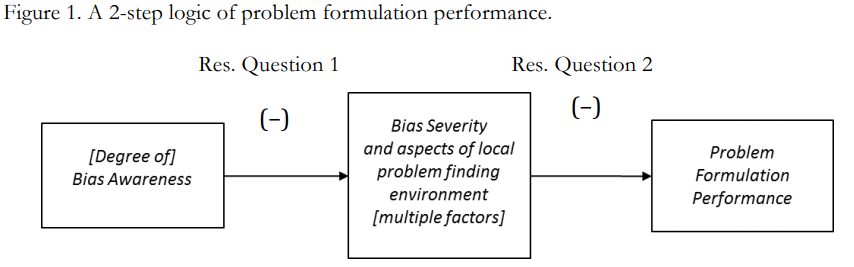
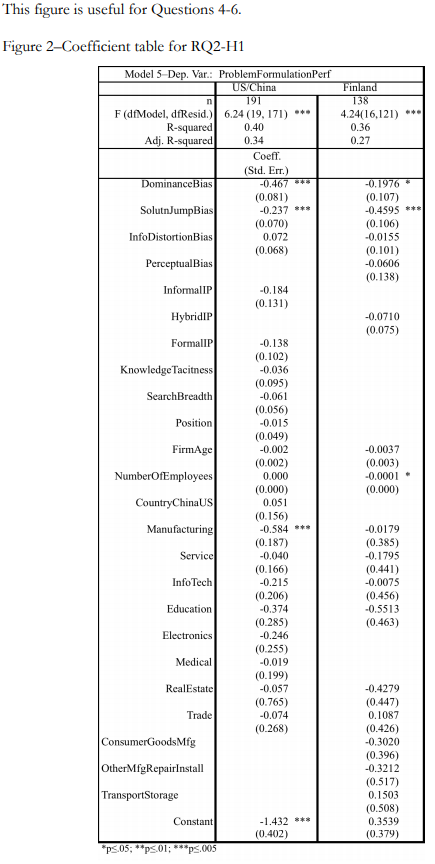
Figure 1. A 2-step logic of problem formulation performance. Res. Question 1 Res. Question 2 (-) O [Degree of] Bias Awareness Bias Severity and aspects of local problem finding environment (multiple factors] Problem Formulation Performance In this table, the RQ1-H1 is explored: The outcome of interest (what we are trying to predict) is Awareness (of biases). Use this table for questions 1-3 and the Extra Credit question. Figure 2Regression coefficients for Stage 1, Awareness predicting Bias Severity. Model 4 PerceptualBias Finland 246 171 174 45913.160) 0.27 0.21 (0.082) 0.000 (0.002) 0.000 (0.000) 0310 0831 0.032 (0.053) Stage I Models Modell Model 2 Model 3 Dependent Variable Dominance Bias SolutnJumpBias InfoDistortion Bias US China Finland US China Finland US China Finland 243 164 241 F(dModel, dResid 3.40 (14,233) *** 1.77(13.150) 17.37 (14,231) 3.8713.151) 8 (14,226) *** 72313.157) R-squared 0.18 0.1329 0.26 0.25 0.15 0.37 Adi, R-squared 0,13 0.0377 0.22 019 0.10 0,32 Awareness -0.023 -0.10 -0.204 -0.796 (0.058) (0.107) (0.064) (0.109) (0.066) (0.093) Search Breadth -0.246 -0.041 -0.192 (0.047) (0.052) (0.054) Postion -0.011 -0.057 -0.035 (0.042) (0.047) (0.048) Fimmel -0.002 0.001 0.000 0.002 0.000 -0.001 (0.002) (0.002) (0.002) (0.002) (0.002) NumberOfEmployees 0.000 0.000 0.000 0.000 0.000 0.000 (0.000) (0.000) (0.000) (0.000) (0.000) (0.000) CountryChinaus (0.117) -0.273 (0.129) (0.132) Competitive Environment 0.116 -0.082 -0.002 (0.071) (0.072) (0.060) Manufacturing 0.252 -0.239 -0.125 -0.333 -0.142 0.197 (0.178) (0.311) (0.196) (0.315) (0.2001 (0.277) Service 0.053 -0.654 0.024 .0.178 -0,089 0.047 (0.148) (0,374) (0.163) (0.378) (0.168) (0327) InfoTech 0.121 -0.290 0.099 -0.869 -0.208 -0.001 (0.180) (0.375) (0.198) (0.379) (0.209) (0333) Education 0.256 -0.015 -0.066 (0.258) (0.385) (0.284) (0.389) (0.289) (0342) Electronics 0.011 0.205 -0.395 (0.250) (0.285) (0.280) Medical 0.179 -0.372 (0.190) (0.209) (0.214) Real Estate -0.227 -0.139 0.378 -0.019 -0,364 0.217 (0.397) (0.389) (0.393) (0.443) (0.338) Trade 0.220 -0.443 0.094 -0.658 0.163 0.053 (0.228) (0.341) (0.251) (0.343) (0.256) (0.300) Consumer Goods Me -0.523 - -0.641 - 0.110 (0,319) (0.322) (0.283) Other MfRepair Install -0.067 0.021 0.377 (0.439) (0.445) TransportStorage (0 791) 0.382 -0.437 0.326 (0.403) (0.408) (0351) Constant 2.156 0.281 0.436 2.463 - -0.073 (0223) 10.300) (0.246) 10.303 (0.252) (0.267) Note: coefficient and/or standard errors shown as 0 have near-zero values on the order of IE-06 or less *p<.05 this figure is useful for questions n table rq2-h1 model dep. var.: problemformulationperf us finland f dresid. r-squared adj. coeff. err. dominance bias solutnjumpbias infodistortionbias perceptual informal ip hybrid formalip knowledge tacitness search breadth position firmage numberofemployees countrychinaus manufacturing service infotech education electronics medical realestate trade consumer goodsmfg othermfg repairinstall transportstorage constant>Step by Step Solution
There are 3 Steps involved in it

Get step-by-step solutions from verified subject matter experts