

Question: 3. More and less variability A researcher designs an intervention to combat homophobia. She also designs a questionnaire to measure homophobia so she can test
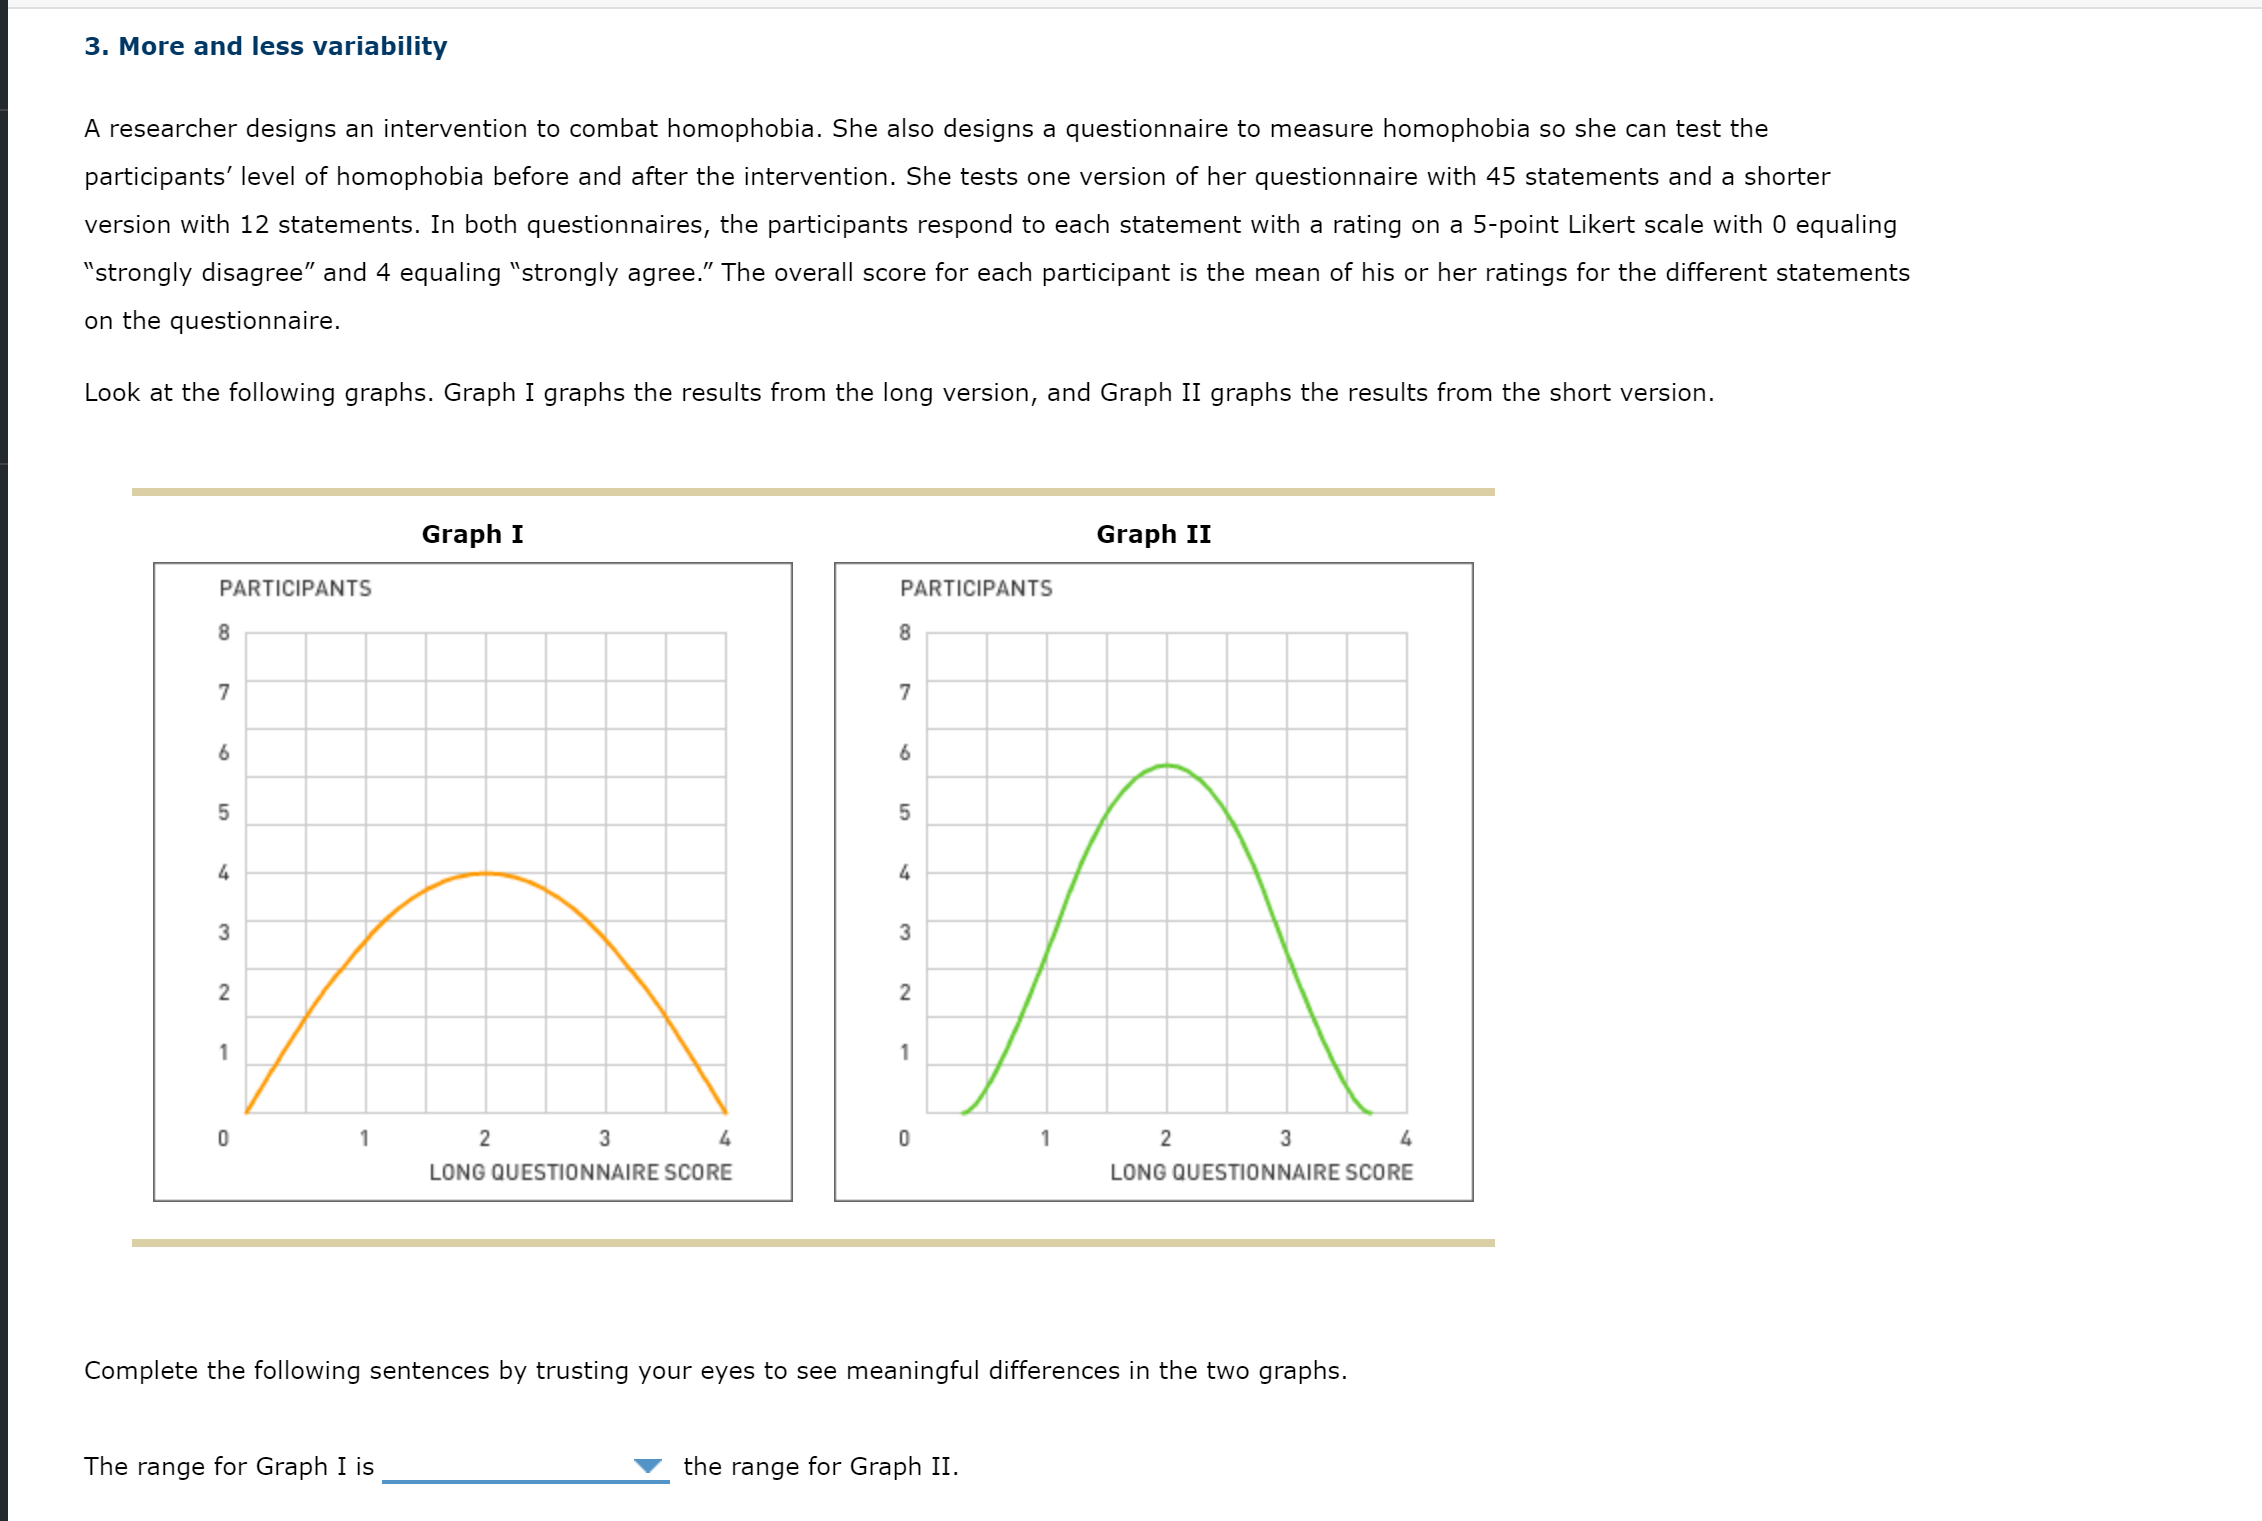
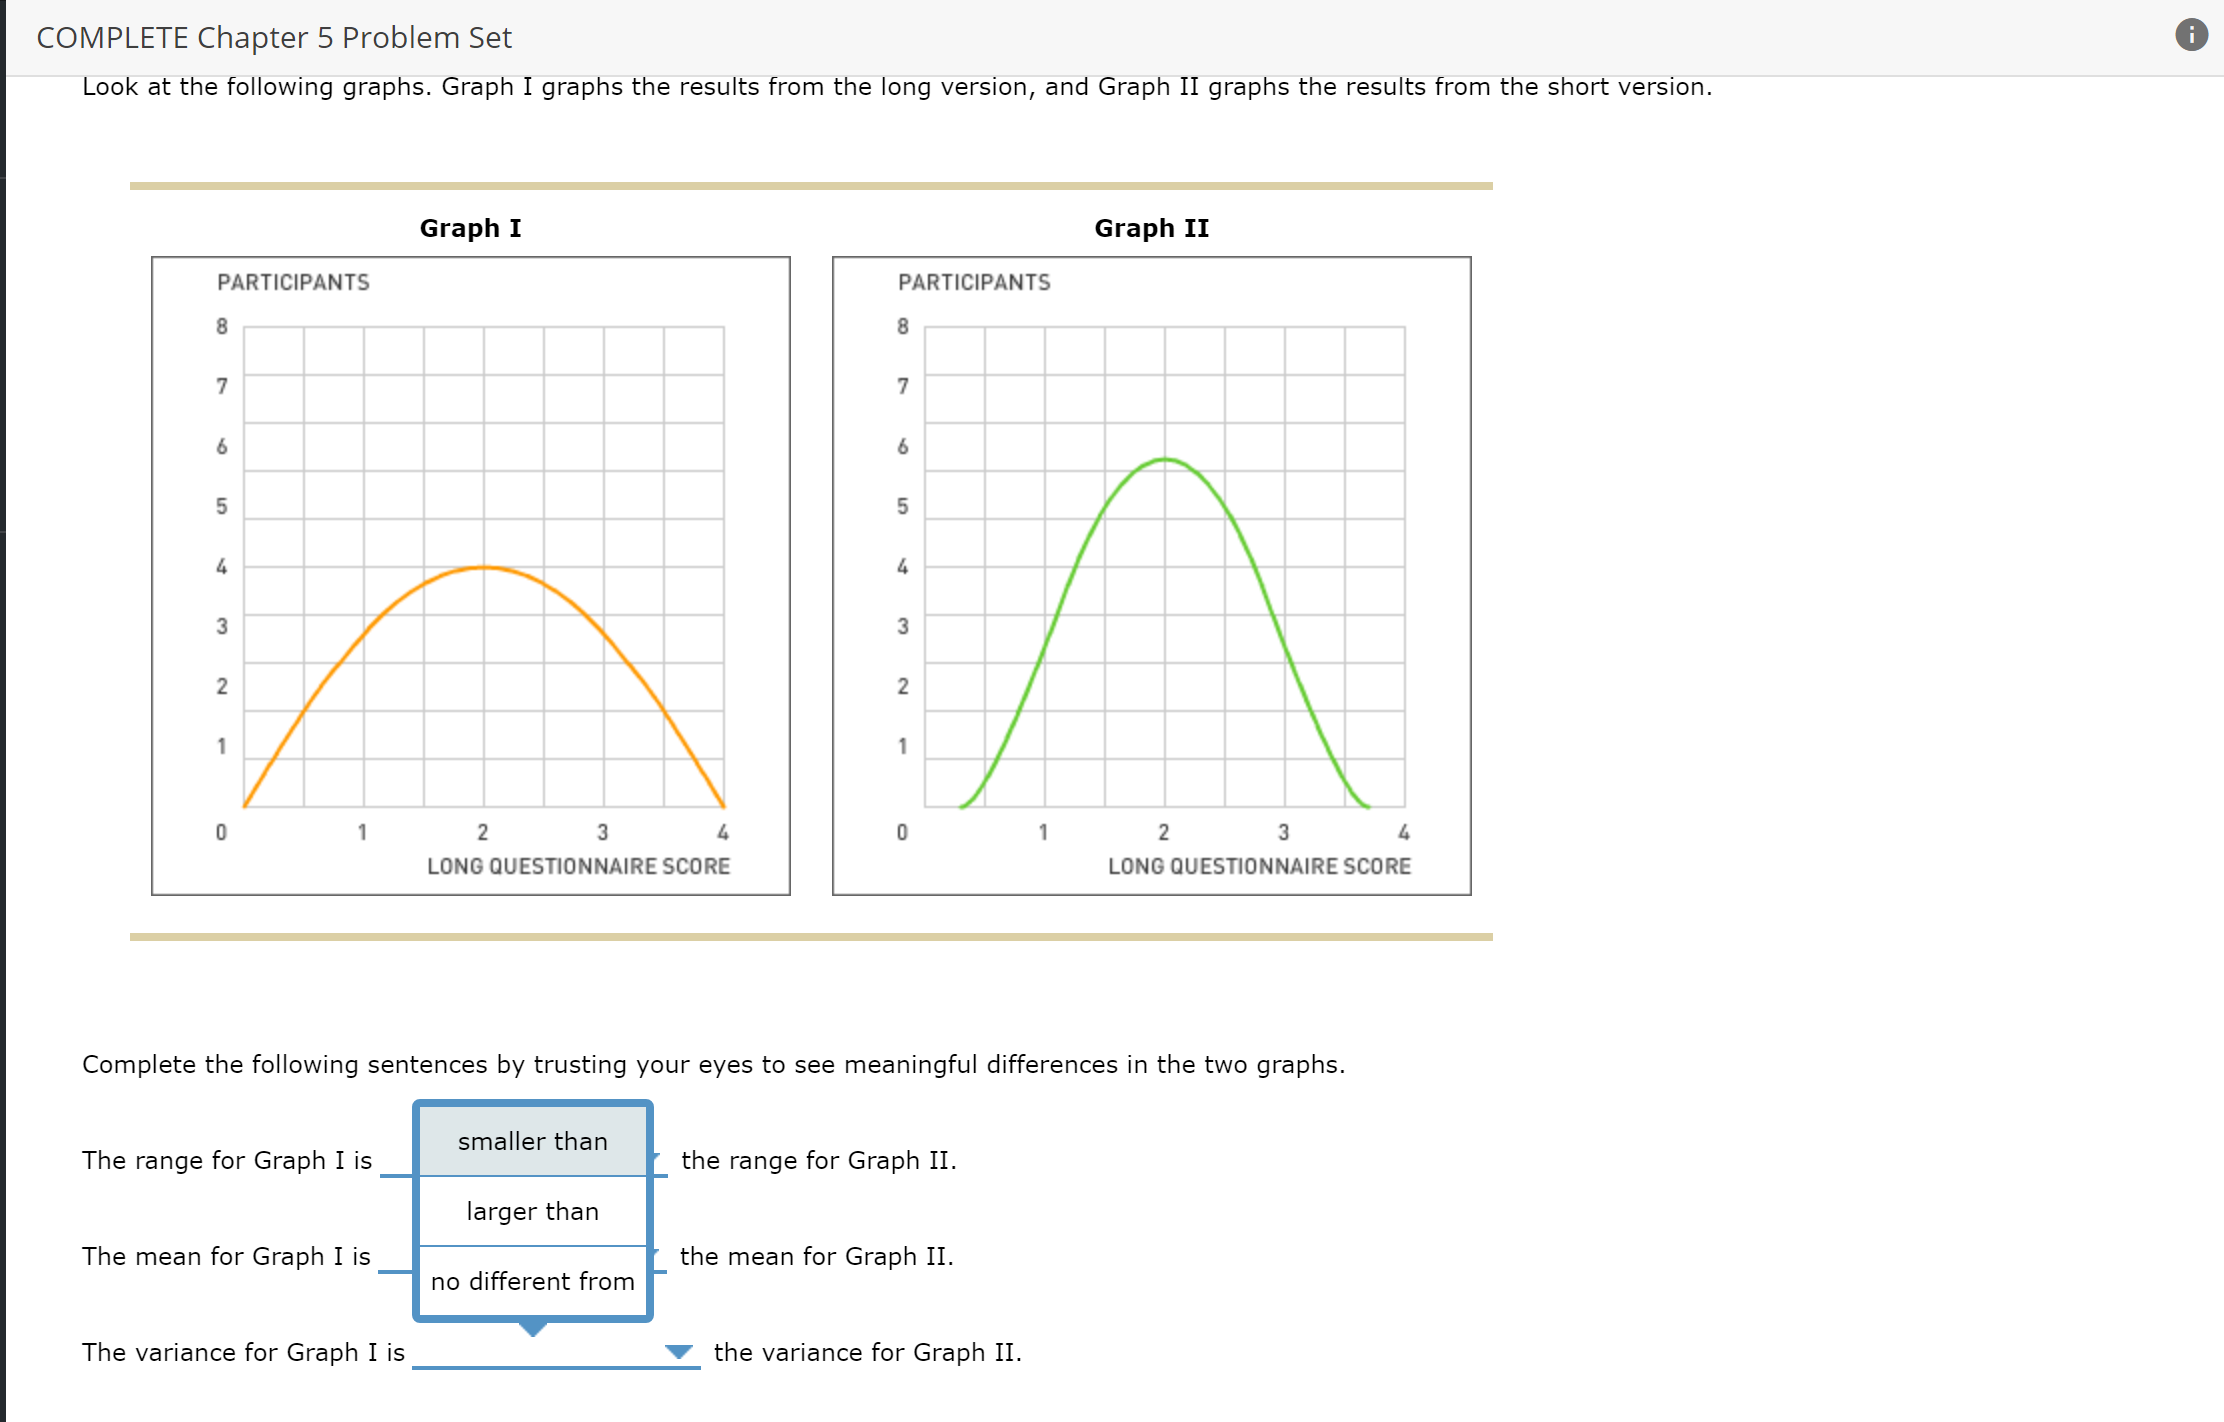
3. More and less variability A researcher designs an intervention to combat homophobia. She also designs a questionnaire to measure homophobia so she can test the participants' level of homophobia before and after the intervention. She tests one version of her questionnaire with 45 statements and a shorter version with 12 statements. In both questionnaires, the participants respond to each statement with a rating on a 5-point Likert scale with O equaling \"strongly disagree\" and 4 equaling \"strongly agree." The overall score for each participant is the mean of his or her ratings for the different statements on the questionnaire. Look at the following graphs. Graph 1 graphs the results from the long version, and Graph II graphs the results from the short version. Graph I Graph 11 PARTICIPANTS PARTICIPANTS B B 7 7 b b 5 5 I. I. 3 3 2 2 I I [I 1 2 3 L [I 1 2 3 A. LONG OUESTIONNAIRE SCORE LONG OUESTIONNAIRE SCORE Complete the following sentences by trusting your eyes to see meaningful differences in the two graphs. The range for Graph 1 is V the range for Graph 11. COMPLETE Chapter 5 Problem Set Look at the following graphs. Graph 1 graphs the results from the long version, and Graph 11 graphs the results from the short version. Graph I Graph II PARTICIPANTS PARTICIPANTS 8 8 7 7 6 6 5 5 1. was 1. 3 / \\ 3 / _ / L\\_ 2 , ' Z 1 I 1 1 u 1 2 3 I. u 1 2 3 1. LONG QUESTIONNAIRE SCORE LONG QUESTIONNAIRE SCORE Complete the following sentences by trusting your eyes to see meaningful differences in the two graphs. The range for Graph 1 is the range for Graph 11. The mean for Graph I is the mean for Graph 11. The variance for Graph 1 is V the variance for Graph 11
Step by Step Solution
There are 3 Steps involved in it

Get step-by-step solutions from verified subject matter experts