

Question: 3) Note: For this problem, you will compute an efficient portfolio in Excel using matrix algebra. To receive credit for this problem you must attach
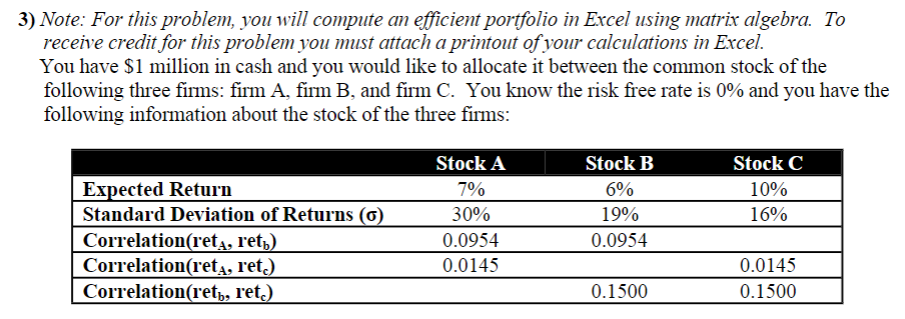
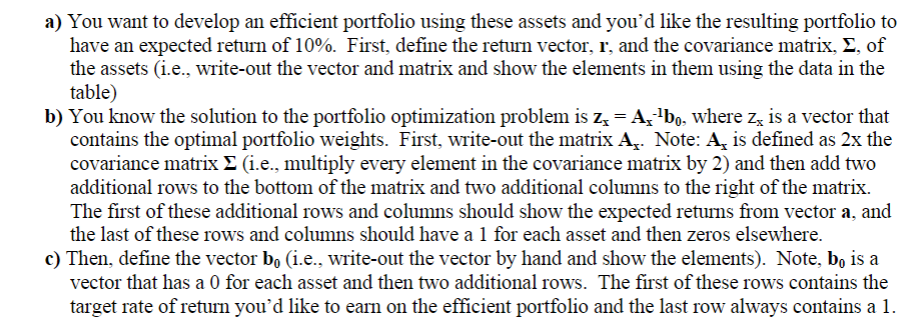
3) Note: For this problem, you will compute an efficient portfolio in Excel using matrix algebra. To receive credit for this problem you must attach a printout of your calculations in Excel. You have $1 million in cash and you would like to allocate it between the common stock of the following three firms: firm A, firm B, and firm C. You know the risk free rate is 0% and you have the following information about the stock of the three firms: Stock A 7% 30% 0.0954 0.0145 Expected Return Standard Deviation of Returns (6) Correlation(reta, ret) Correlation(reta, ret.) Correlationret, ret.) Stock B 6% 19% 0.0954 Stock C 10% 16% 0.0145 0.1500 0.1500 a) You want to develop an efficient portfolio using these assets and you'd like the resulting portfolio to have an expected return of 10%. First, define the return vector, r, and the covariance matrix, 2, of the assets (i.e., write-out the vector and matrix and show the elements in them using the data in the table) b) You know the solution to the portfolio optimization problem is ze=A, 'bo, where zz is a vector that contains the optimal portfolio weights. First, write-out the matrix A . Note: A is defined as 2x the covariance matrix i.e., multiply every element in the covariance matrix by 2) and then add two additional rows to the bottom of the matrix and two additional columns to the right of the matrix. The first of these additional rows and columns should show the expected returns from vector a, and the last of these rows and columns should have a 1 for each asset and then zeros elsewhere. c) Then, define the vector b, (i.e., write-out the vector by hand and show the elements). Note, bo is a vector that has a 0 for each asset and then two additional rows. The first of these rows contains the target rate of return you'd like to earn on the efficient portfolio and the last row always contains a 1. 3) Note: For this problem, you will compute an efficient portfolio in Excel using matrix algebra. To receive credit for this problem you must attach a printout of your calculations in Excel. You have $1 million in cash and you would like to allocate it between the common stock of the following three firms: firm A, firm B, and firm C. You know the risk free rate is 0% and you have the following information about the stock of the three firms: Stock A 7% 30% 0.0954 0.0145 Expected Return Standard Deviation of Returns (6) Correlation(reta, ret) Correlation(reta, ret.) Correlationret, ret.) Stock B 6% 19% 0.0954 Stock C 10% 16% 0.0145 0.1500 0.1500 a) You want to develop an efficient portfolio using these assets and you'd like the resulting portfolio to have an expected return of 10%. First, define the return vector, r, and the covariance matrix, 2, of the assets (i.e., write-out the vector and matrix and show the elements in them using the data in the table) b) You know the solution to the portfolio optimization problem is ze=A, 'bo, where zz is a vector that contains the optimal portfolio weights. First, write-out the matrix A . Note: A is defined as 2x the covariance matrix i.e., multiply every element in the covariance matrix by 2) and then add two additional rows to the bottom of the matrix and two additional columns to the right of the matrix. The first of these additional rows and columns should show the expected returns from vector a, and the last of these rows and columns should have a 1 for each asset and then zeros elsewhere. c) Then, define the vector b, (i.e., write-out the vector by hand and show the elements). Note, bo is a vector that has a 0 for each asset and then two additional rows. The first of these rows contains the target rate of return you'd like to earn on the efficient portfolio and the last row always contains a 1
Step by Step Solution
There are 3 Steps involved in it

Get step-by-step solutions from verified subject matter experts