

Question: 3. On Blackboard, I've uploaded some R code via a text file (PS3_RCode.txt) and some .xlsx data (PS3_Data.xlsx). You will need to upload the PS3_Data.xlsx
3. On Blackboard, I've uploaded some R code via a text file (PS3_RCode.txt) and some .xlsx data (PS3_Data.xlsx). You will need to upload the PS3_Data.xlsx file into RStudio Cloud and open a new R script and copy/paste the provided text file into that R script but once you've done that you can run the entire code and it will give you some regression results. Here we're using National Health Interview Survey data on a health outcome (BMI>25 or overweight) and some factors that might contribute to that or not. So our regression's dependent variable is whether the person is overweight and the independent variables are age, education, natural log of income, race, gender and smoking status.
a. In the R code, I've used the following code
PS3Data$Male
Explain what I'm doing here in R... i.e. what does this code create in our R dataframe?
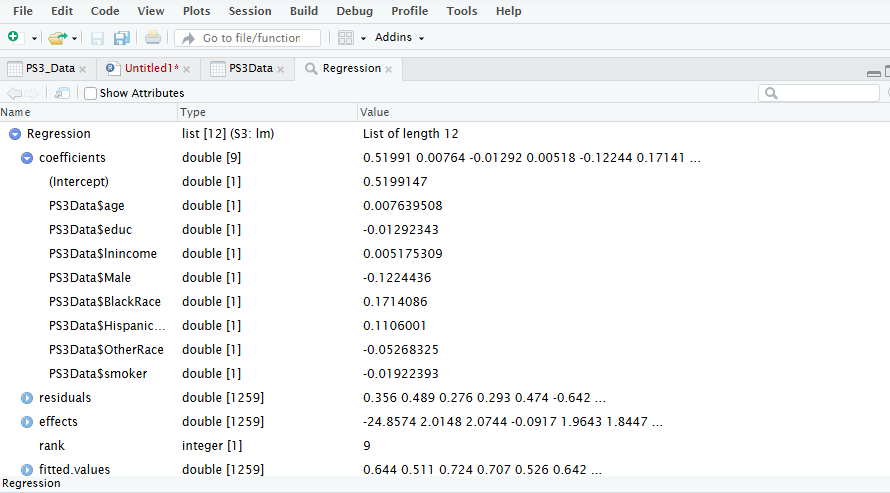
b. Now let's focus on our regression and interpret some of the coefficients. Interpret the coefficient
on education (PS3Data$educ: measured in years of education) in terms of magnitude and statistical significance.
c. Do the same for PS3Data$lnincome. Recall it's in natural log terms!
d. And finally interpret the coefficient for PS3Data$Male.
Step by Step Solution
There are 3 Steps involved in it

Get step-by-step solutions from verified subject matter experts