

Question: 3. On the graph below, we visualize the validation error of K-Nearest Neighbors model. Error rate 50 9 30 20 10 10 K-Value Validation
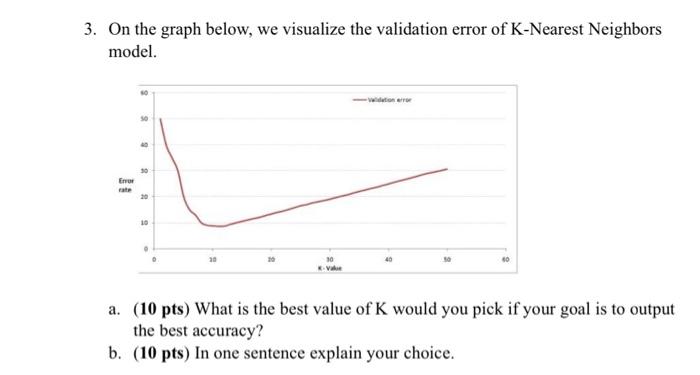
3. On the graph below, we visualize the validation error of K-Nearest Neighbors model. Error rate 50 9 30 20 10 10 K-Value Validation error a. (10 pts) What is the best value of K would you pick if your goal is to output the best accuracy? b. (10 pts) In one sentence explain your choice.
Step by Step Solution
★★★★★
3.50 Rating (163 Votes )
There are 3 Steps involved in it
1 Expert Approved Answer
Step: 1 Unlock

a Based on the graph the best value of K for ... View full answer
Question Has Been Solved by an Expert!
Get step-by-step solutions from verified subject matter experts
Step: 2 Unlock
Step: 3 Unlock