

Question: 3 please attempt all a1 a2 b1 b2 Prepare a scatter diagram for each of the following pairs of variables and then express in words
3 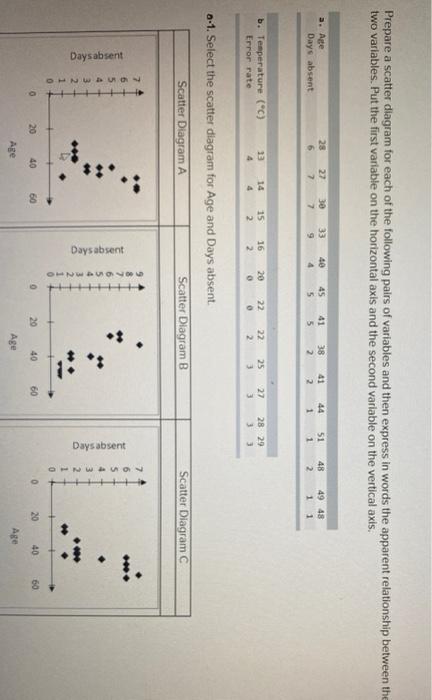
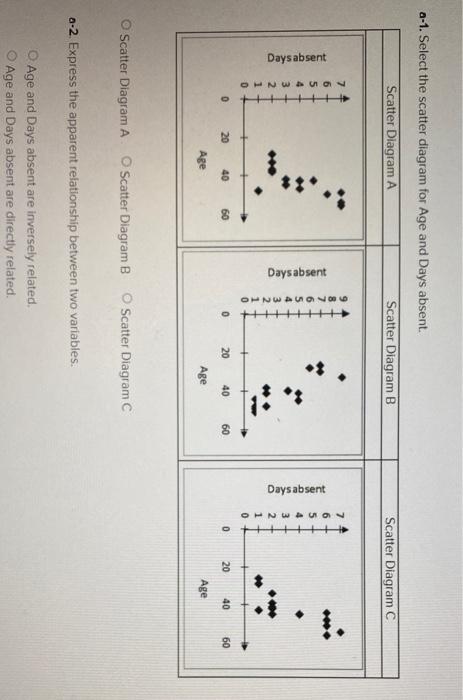
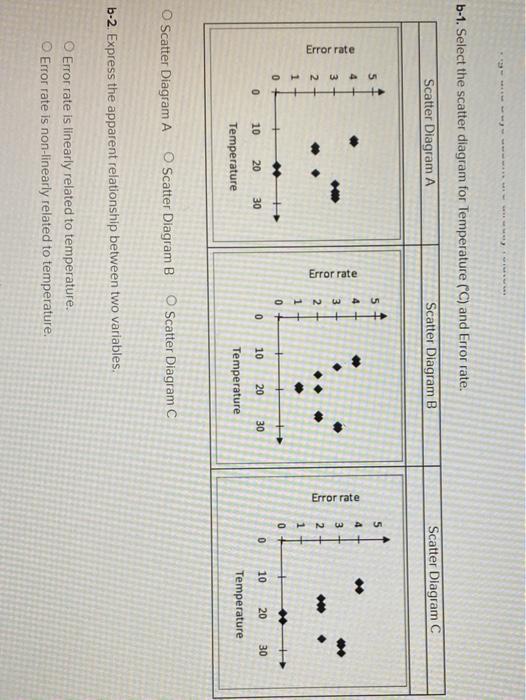
Prepare a scatter diagram for each of the following pairs of variables and then express in words the apparent relationship between the two variables. Put the first variable on the horizontal axis and the second variable on the vertical axis, a. Age Days absent 28 6 27 7 30 7 33 9 40 4 45 5 41 5 38 2 41 2 1 51 1 48 2 4948 1 1 14 b. Temperature (C) Error rate 12 4 15 2 16 2 22 0 22 2 25 3 27 3 28 29 3 3 0 0-1. Select the scatter diagram for Age and Days absent Scatter Diagram A Scatter Diagram B Scatter Diagram 7 6 5 4 . Days absent OHNW un in Days absent Days absent OLUN 2 1 0 400 00 0 20 40 60 20 40 60 0 20 40 60 Age Age Age a-1. Select the scatter diagram for Age and Days absent. Scatter Diagram A Scatter Diagram B Scatter Diagram C Days absent +++++++++ Days absent . ONWOOD +++++++++ Days absent ONW OMNO ++++++ . 0 20 40 60 0 20 40 60 0 20 40 60 Age Age Age Scatter Diagram A Scatter Diagram B Scatter Diagram C 0-2. Express the apparent relationship between two variables. Age and Days absent are inversely related, Age and Days absent are directly related. b-1. Select the scatter diagram for Temperature (C) and Error rate. Scatter Diagram A Scatter Diagram B Scatter Diagram C 5 5 4 3 4 4 3 3 3 Error rate Error rate Error rate 2 N 1 1 + 1 + 0 + 0+ 30 0 10 0 0 10 20 20 20 30 30 10 Temperature Temperature Temperature O Scatter Diagram A Scatter Diagram B O Scatter Diagram C b-2. Express the apparent relationship between two variables. Error rate is linearly related to temperature. Error rate is non-linearly related to temperature please attempt all
a1 a2
b1 b2
Step by Step Solution
There are 3 Steps involved in it
1 Expert Approved Answer
Step: 1 Unlock

Question Has Been Solved by an Expert!
Get step-by-step solutions from verified subject matter experts
Step: 2 Unlock
Step: 3 Unlock