

Question: 3. Please provide a plan and set goals for each scorecard area based on your Q1 results and owner expectations. Goals should include growth targets
 3. Please provide a plan and set goals for each scorecard area based on your Q1 results and owner expectations. Goals should include growth targets and the ranking within your competitive set. I ask that you insert tables into your report to show your statistics and financial goals. A table will be easier for me to read and for you to organize your information.
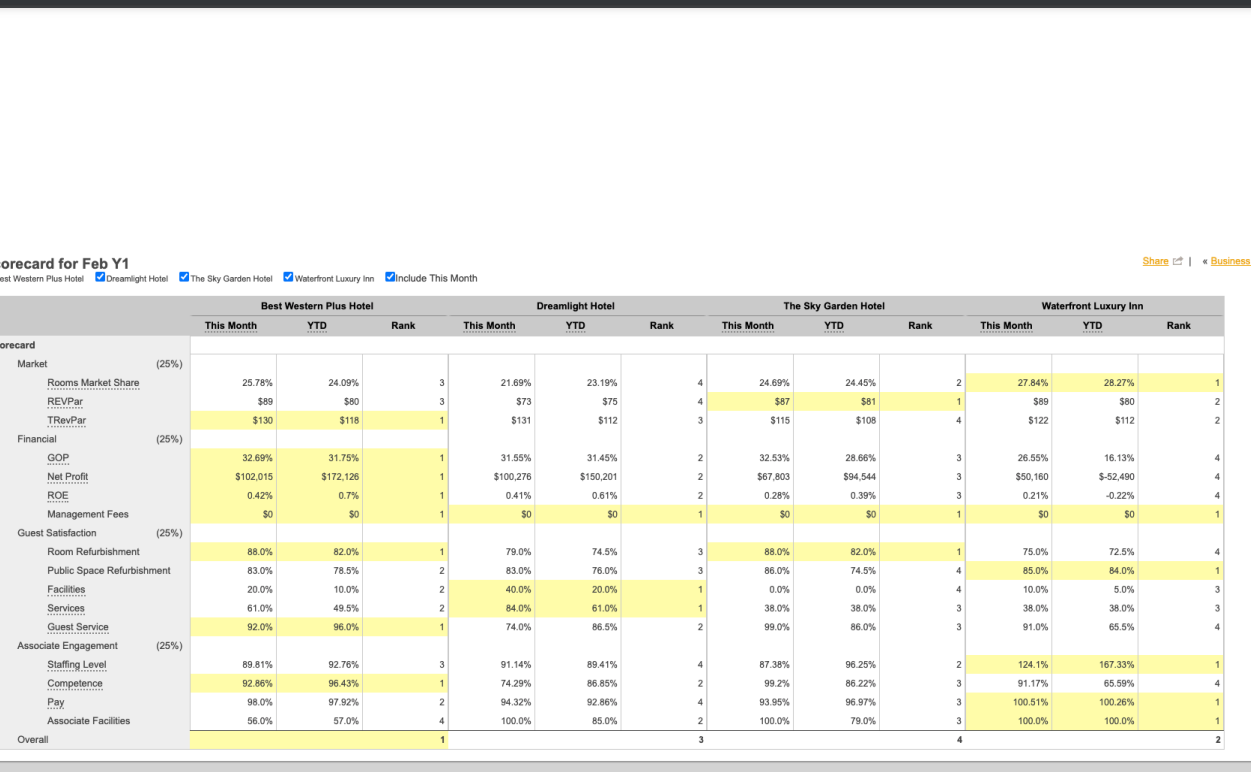
( Sky Garden Hotel)
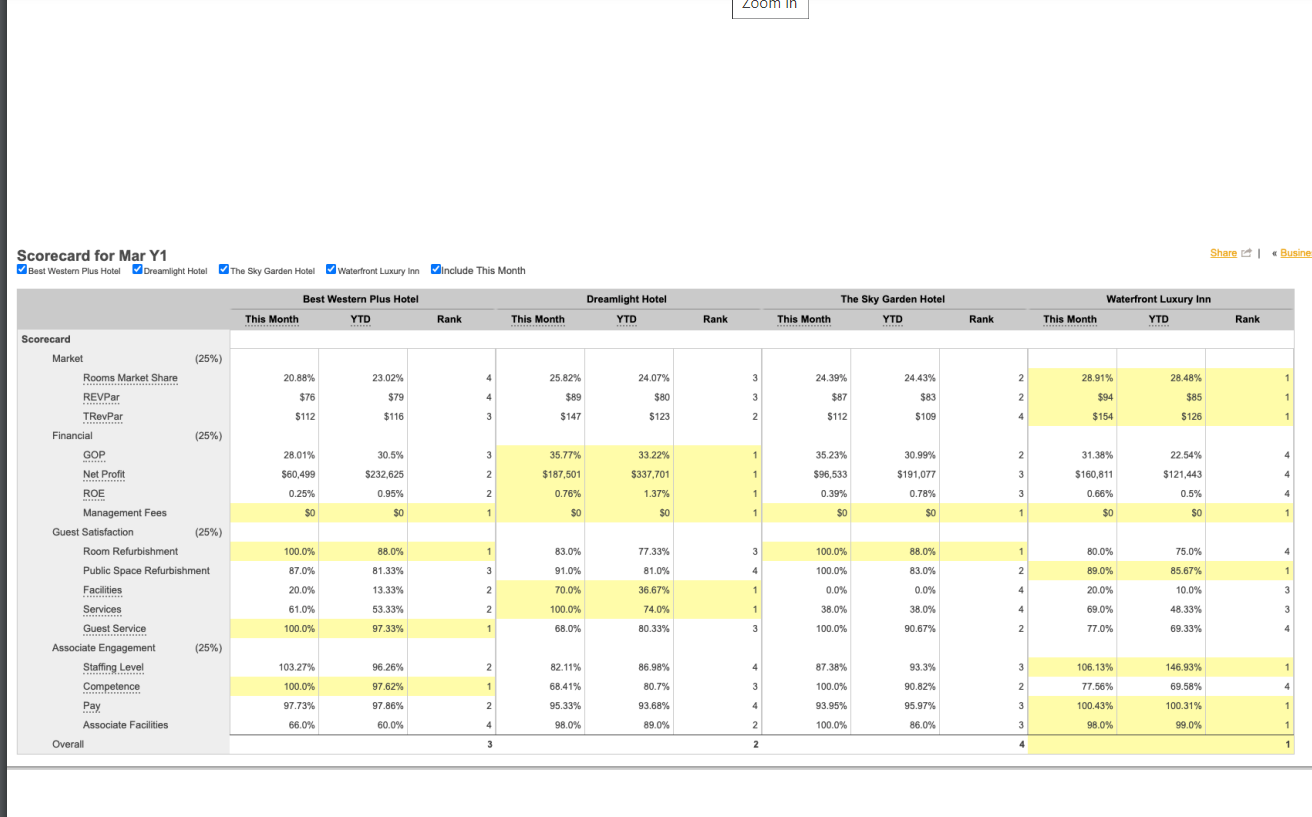
Zoom in Share & Busine Scorecard for Mar Y1 Best Western Plus Hotel Dreamlight Hotel The Sky Garden Hotel Waterfront Luxury Inn include This Month Best Western Plus Hotel Dreamlight Hotel The Sky Garden Hotel YTD Waterfront Luxury Inn YTD This Month YTD Rank This Month YTD Rank This Month Rank This Month Rank Scorecard Market (25%) % 20.88% % 23.02% 4 25.82% 24.07% 3 24.43% 2 28.91% 28.48% 1 Rooms Market Share REVPar 24.39% % $87 $76 $79 4 $89 $80 3 $83 2 $94 $85 1 TRevPar $112 $116 3 $147 $123 2 $112 $109 4 $154 $126 1 (25%) Financial GOP 30.5% 3 35.77% 33.22% 1 35.23% 30.99% 2 31,38% 22.54% 28.01% $60,499 Net Profit $232,625 2 1 $96,533 $191,077 3 $160,811 $121,443 4 $337,701 1.37% ROE 0.25% 0.95% $187,501 0.76% $0 $O 2 1 0.39% 0.78% 3 0.66% 0.5% 4 $ SO $0 1 $0 1 $O $0 1 $0 $0 1 100.0% 88.0% 1 3 100.0% 88.0% 1 80.0% 75.0% 4 77.33% 81.0% 87.0% 81.33% 83.0% 91.0% 70.0% 3 4 100.0% 83.0% 2 89.0% 85.67% 1 20.0% 13.33% % 2 36.67% 1 0.0% 0.0% 4 20.0% 10.0% 3 61.0% 53.33% 2 100.0% 74.0% 1 38.0% 4 69.0% 3 L. Management Fees Guest Satisfaction (25%) ) Room Refurbishment Public Space Refurbishment Facilities Services Guest Service Associate Engagement (25%) Staffing Level Competence Pay Associate Facilities Overall 38.0% 90.67% 48.33% 69.33% 100.0% 97.33% 1 68.0% 80.33% 3 100.0% 2 77.0% 4 103.27% 96.26% 2 82.11% 86.98% 4 87.38% 93.3% 3 106.13% 146.93% 1 100.0% 97.62% 1 68.41% 80.7% 3 100.0% 90.82% 2 77.56% 69.58% 4 97.73% 97.86% 2 95.33% 93.68% 4 93.95% 95.97% 3 100.31% 1 100.43% 98.0% % 66.0% 60.0% 4 98.0% 89.0% 2 2 100.0% 86.0% 3 99.0% 1 3 2 4 1 1 Share Business orecard for Feb Y1 est Western Plus Hotel Dreamlight Hotel The Sky Garden Hotel Waterfront Luxury Inn include This Month Dreamlight Hotel Waterfront Luxury Inn Best Western Plus Hotel This Month YTD The Sky Garden Hotel YTD Rank This Month YTD Rank This Month Rank This Month YTD Rank orecard Market (25%) % 25.78% 24.09% 3 4 24.69% 24.45% 2 27.84% 1 Rooms Market Share REVPar TRevPar 21.69% % $73 28.27% $80 $89 $80 23.19% % $75 $112 3 4 $87 $81 1 $89 2 $130 $118 1 $131 3 $115 $108 4 $122 $112 2 Financial (25%) ) GOP 31.75% 1 31.55% 31.45% 2 28.66% 3 26.55% 16.13% 4 32.69% $102,015 0.42% 1 $100,276 2 3 32.53% $67,803 0.28% $50, 160 $172,126 0.7% $-52,490 $150,201 0.61% $0 $94,544 0.39% 1 0.41% 2 2 3 0.21% -0.22% 4 SO $0 1 SO 1 $0 $0 1 SO SO 1 88.0% 82.0% 1 79.0% 74.5% 3 88.0% 82.0% 1 75.0% 72.5% 4 83.0% 78.5% 2 83.0% 76.0% 3 86.0% 4 85.0% 84.0% 1 Net Profit ROE Management Fees Guest Satisfaction (25%) Room Refurbishment Public Space Refurbishment Facilities Services Guest Service Associate Engagement (25%) % Staffing Level Competence Pay 74.5% 0.0% 10.0% 2 1 4 4 10.0% 5.0% 3 20.0% 61.0% 40.0% 84.0% 20.0% 61.0% 0.0% 38.0% 49.5% 2 1 38.0% 3 38.0% 38.0% 3 92.0% 96.0% 1 1 74.0% 86.5% % 2 99.0% 86.0% 3 91.0% 65.5% 4 89.81% 92.76% 3 3 91.14% 89.41% 4 87.38% 96.25% 2 124.1% 167.33% 1 92.86% 96.43% 1 74.29% 86.85% 2 99.2% 3 91.17% 4 86.22% 96.97% 65.59% 100.26% 98.0% 97.92% 2 94.32% 92.86% 4 4 93.95% 3 100.51% 1 Associate Facilities 56.0% 57.0% 100.0% 85.0% 2 100.0% 79.0% 3 100.0% 100.0% 1 Overall 1 3 4 2 Zoom in Share & Busine Scorecard for Mar Y1 Best Western Plus Hotel Dreamlight Hotel The Sky Garden Hotel Waterfront Luxury Inn include This Month Best Western Plus Hotel Dreamlight Hotel The Sky Garden Hotel YTD Waterfront Luxury Inn YTD This Month YTD Rank This Month YTD Rank This Month Rank This Month Rank Scorecard Market (25%) % 20.88% % 23.02% 4 25.82% 24.07% 3 24.43% 2 28.91% 28.48% 1 Rooms Market Share REVPar 24.39% % $87 $76 $79 4 $89 $80 3 $83 2 $94 $85 1 TRevPar $112 $116 3 $147 $123 2 $112 $109 4 $154 $126 1 (25%) Financial GOP 30.5% 3 35.77% 33.22% 1 35.23% 30.99% 2 31,38% 22.54% 28.01% $60,499 Net Profit $232,625 2 1 $96,533 $191,077 3 $160,811 $121,443 4 $337,701 1.37% ROE 0.25% 0.95% $187,501 0.76% $0 $O 2 1 0.39% 0.78% 3 0.66% 0.5% 4 $ SO $0 1 $0 1 $O $0 1 $0 $0 1 100.0% 88.0% 1 3 100.0% 88.0% 1 80.0% 75.0% 4 77.33% 81.0% 87.0% 81.33% 83.0% 91.0% 70.0% 3 4 100.0% 83.0% 2 89.0% 85.67% 1 20.0% 13.33% % 2 36.67% 1 0.0% 0.0% 4 20.0% 10.0% 3 61.0% 53.33% 2 100.0% 74.0% 1 38.0% 4 69.0% 3 L. Management Fees Guest Satisfaction (25%) ) Room Refurbishment Public Space Refurbishment Facilities Services Guest Service Associate Engagement (25%) Staffing Level Competence Pay Associate Facilities Overall 38.0% 90.67% 48.33% 69.33% 100.0% 97.33% 1 68.0% 80.33% 3 100.0% 2 77.0% 4 103.27% 96.26% 2 82.11% 86.98% 4 87.38% 93.3% 3 106.13% 146.93% 1 100.0% 97.62% 1 68.41% 80.7% 3 100.0% 90.82% 2 77.56% 69.58% 4 97.73% 97.86% 2 95.33% 93.68% 4 93.95% 95.97% 3 100.31% 1 100.43% 98.0% % 66.0% 60.0% 4 98.0% 89.0% 2 2 100.0% 86.0% 3 99.0% 1 3 2 4 1 1 Share Business orecard for Feb Y1 est Western Plus Hotel Dreamlight Hotel The Sky Garden Hotel Waterfront Luxury Inn include This Month Dreamlight Hotel Waterfront Luxury Inn Best Western Plus Hotel This Month YTD The Sky Garden Hotel YTD Rank This Month YTD Rank This Month Rank This Month YTD Rank orecard Market (25%) % 25.78% 24.09% 3 4 24.69% 24.45% 2 27.84% 1 Rooms Market Share REVPar TRevPar 21.69% % $73 28.27% $80 $89 $80 23.19% % $75 $112 3 4 $87 $81 1 $89 2 $130 $118 1 $131 3 $115 $108 4 $122 $112 2 Financial (25%) ) GOP 31.75% 1 31.55% 31.45% 2 28.66% 3 26.55% 16.13% 4 32.69% $102,015 0.42% 1 $100,276 2 3 32.53% $67,803 0.28% $50, 160 $172,126 0.7% $-52,490 $150,201 0.61% $0 $94,544 0.39% 1 0.41% 2 2 3 0.21% -0.22% 4 SO $0 1 SO 1 $0 $0 1 SO SO 1 88.0% 82.0% 1 79.0% 74.5% 3 88.0% 82.0% 1 75.0% 72.5% 4 83.0% 78.5% 2 83.0% 76.0% 3 86.0% 4 85.0% 84.0% 1 Net Profit ROE Management Fees Guest Satisfaction (25%) Room Refurbishment Public Space Refurbishment Facilities Services Guest Service Associate Engagement (25%) % Staffing Level Competence Pay 74.5% 0.0% 10.0% 2 1 4 4 10.0% 5.0% 3 20.0% 61.0% 40.0% 84.0% 20.0% 61.0% 0.0% 38.0% 49.5% 2 1 38.0% 3 38.0% 38.0% 3 92.0% 96.0% 1 1 74.0% 86.5% % 2 99.0% 86.0% 3 91.0% 65.5% 4 89.81% 92.76% 3 3 91.14% 89.41% 4 87.38% 96.25% 2 124.1% 167.33% 1 92.86% 96.43% 1 74.29% 86.85% 2 99.2% 3 91.17% 4 86.22% 96.97% 65.59% 100.26% 98.0% 97.92% 2 94.32% 92.86% 4 4 93.95% 3 100.51% 1 Associate Facilities 56.0% 57.0% 100.0% 85.0% 2 100.0% 79.0% 3 100.0% 100.0% 1 Overall 1 3 4 2
Step by Step Solution
There are 3 Steps involved in it

Get step-by-step solutions from verified subject matter experts