

Question: 3. Plot the data given in the excel sheet and index all the peaks if x-rays with a wavelength of 0.1542 nm were used. Using
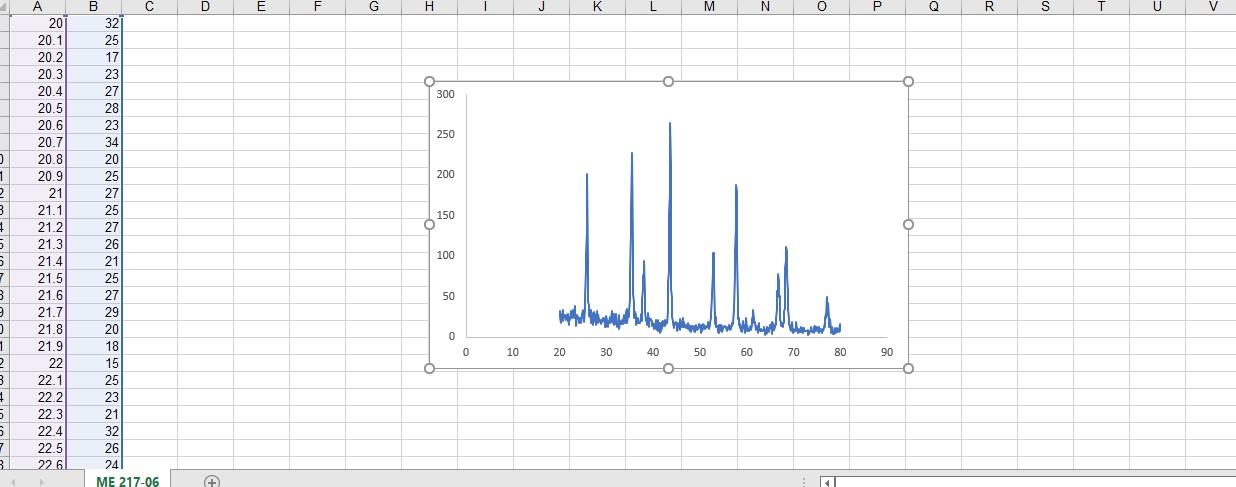
3. Plot the data given in the excel sheet and index all the peaks if x-rays with a wavelength of 0.1542 nm were used. Using the procedure presented in the lab, identify the following: a. the indices of the planes that produce each of the peaks b. the crystal structure of the metal c. the interplanar distances. d. for each set of planes hakl . d. the lattice parameter, a e. the atomic radius f. the most probable metal that produced this diffraction pattern A C D E LL G H I J K M N OP a Q R TU o 300 CO NOWN 250 200 2 150 o 21.3 100 21.5 21.6 50 10 40 60 70 BO 90 NNN AWN NOVO ME 217-06 +
Step by Step Solution
There are 3 Steps involved in it
1 Expert Approved Answer
Step: 1 Unlock

Question Has Been Solved by an Expert!
Get step-by-step solutions from verified subject matter experts
Step: 2 Unlock
Step: 3 Unlock