

Question: 3 Plotting (5*2=10 points) Plot the following functions in Matlab (make sure to have appropriate horizontal and vertical scales). 1. f(x) = 23 - 3x
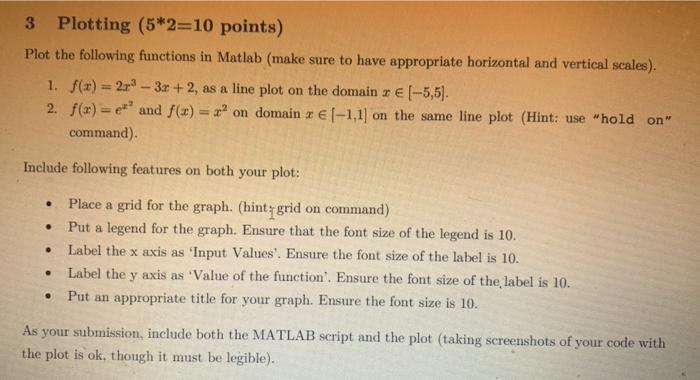
3 Plotting (5*2=10 points) Plot the following functions in Matlab (make sure to have appropriate horizontal and vertical scales). 1. f(x) = 23 - 3x + 2, as a line plot on the domain ref-5,5). 2. f(x) = pr and f(x) = x2 on domain x (-1,1) on the same line plot (Hint: use "hold on" command) Include following features on both your plot: . Place a grid for the graph. (hint: grid on command) Put a legend for the graph. Ensure that the font size of the legend is 10. Label the x axis as 'Input Values'. Ensure the font size of the label is 10. Label the y axis as 'Value of the function'. Ensure the font size of the label is 10. Put an appropriate title for your graph. Ensure the font size is 10. . . As your submission, include both the MATLAB script and the plot taking screenshots of your code with the plot is ok, though it must be legible). 3 Plotting (5*2=10 points) Plot the following functions in Matlab (make sure to have appropriate horizontal and vertical scales). 1. f(x) = 23 - 3x + 2, as a line plot on the domain ref-5,5). 2. f(x) = pr and f(x) = x2 on domain x (-1,1) on the same line plot (Hint: use "hold on" command) Include following features on both your plot: . Place a grid for the graph. (hint: grid on command) Put a legend for the graph. Ensure that the font size of the legend is 10. Label the x axis as 'Input Values'. Ensure the font size of the label is 10. Label the y axis as 'Value of the function'. Ensure the font size of the label is 10. Put an appropriate title for your graph. Ensure the font size is 10. . . As your submission, include both the MATLAB script and the plot taking screenshots of your code with the plot is ok, though it must be legible)
Step by Step Solution
There are 3 Steps involved in it

Get step-by-step solutions from verified subject matter experts