

Question: 3) Plotting in MATLAB 1. Plot separately the following functions in [-30 30] and the step size is 0.5. (10 points) y=3x2 + 5x +
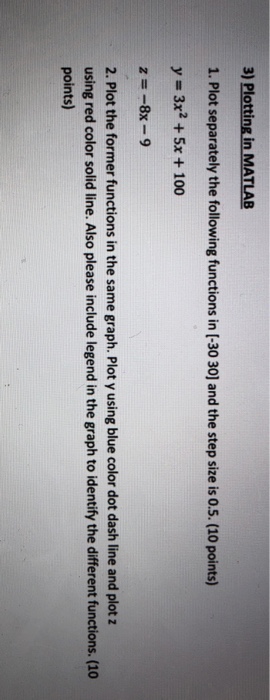
3) Plotting in MATLAB 1. Plot separately the following functions in [-30 30] and the step size is 0.5. (10 points) y=3x2 + 5x + 100 2. Plot the former functions in the same graph. Plot y using blue color dot dash line and plot z using red color solid line. Also please include legend in the graph to identify the different functions. (10 points)
Step by Step Solution
There are 3 Steps involved in it
1 Expert Approved Answer
Step: 1 Unlock

Question Has Been Solved by an Expert!
Get step-by-step solutions from verified subject matter experts
Step: 2 Unlock
Step: 3 Unlock