

Question: ( 3 points ) Step 1 Use Excel's Data Analysis - > Regression on first two - week's ( i . e . , periods
points Step Use Excel's Data AnalysisRegression on first twoweek's ie periods data to create the level and trend estimates in period
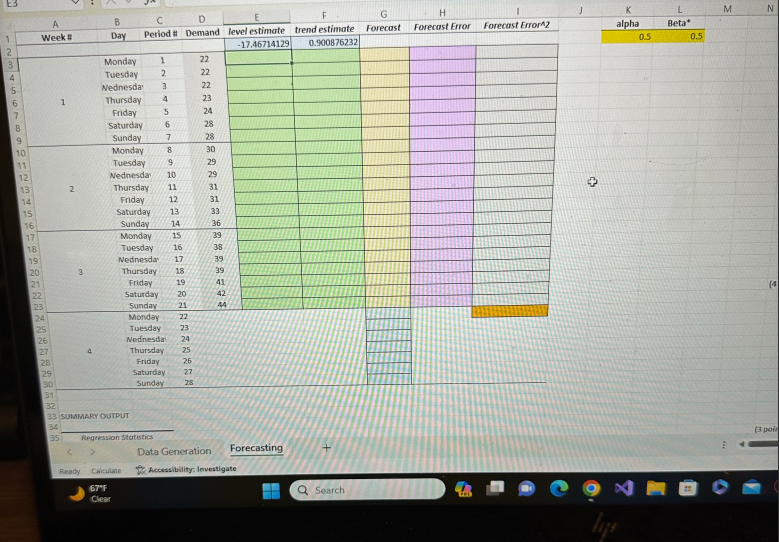
In doing so under Output options of the Regression window, select Output Range and select A
This will give the regression summary under the data table see below the data table
Use the regression result to populate cells E and Fblue cells in row
Then, explain which values of the regression results you used
as level and trend estimates for period and why. sentences would be sufficient.
points Step Calculate forecasts and forecasting errors. To do so:
Initially set alpha and beta in cells and
After that, calculate the forecast made in period ofor periad ;
then assume that demand for period is revealed and calculate the updated level and trend estimates for period
and then calculate the forecast made in period for period ; and so on
until you calculate the forecast made in period for period and you calculated the level and trend estimates for period
Put the formulas for level and trend estimates in columns E green cells and F green cells respectively.
and formulas for forecast calculations in column yellowish cells
Once onestepahead forecasts are calculated for periods calculate the forecast errors and squared foreckst enrors
in columns pink cells and I gray cells respectively
Finally, write the formula for sum of squared errors in cell orange cell
points step Determine the optimal alphs and beta" values that will minimse the sum of squared errors. points Step Determine the optimal alpha and beta values that will minimize the sum of squared errors.
To do so go to Solver and setup the optimization problem
Do not forget to add the constraints that the parameters values should be
And select GRG Nonlinear from the solving method
Report how much the sum of the squared errors changed below
points Step After getting the optimal alpha and beta" values, calculate the forecasts made in period
for periods in cells G:blue cells To do so write the formulas. That is
do not type in just values
point Step is the method used biased? Explain why briefly.
Shaw your calculations, Your can have extra calculations on columns and L sentences should be sufficient
point Step Discuss how can you improve this forecasting approach? What could you make differently for better accuracy, if possible?
Discuss the coverall process and any improvement suggestions. sentences would be sufficient.
Step by Step Solution
There are 3 Steps involved in it
1 Expert Approved Answer
Step: 1 Unlock

Question Has Been Solved by an Expert!
Get step-by-step solutions from verified subject matter experts
Step: 2 Unlock
Step: 3 Unlock