

Question: 3 Problem # 2. The following frequency distribution table represents the time (in seconds) it takes the victim of a crime to call the police.
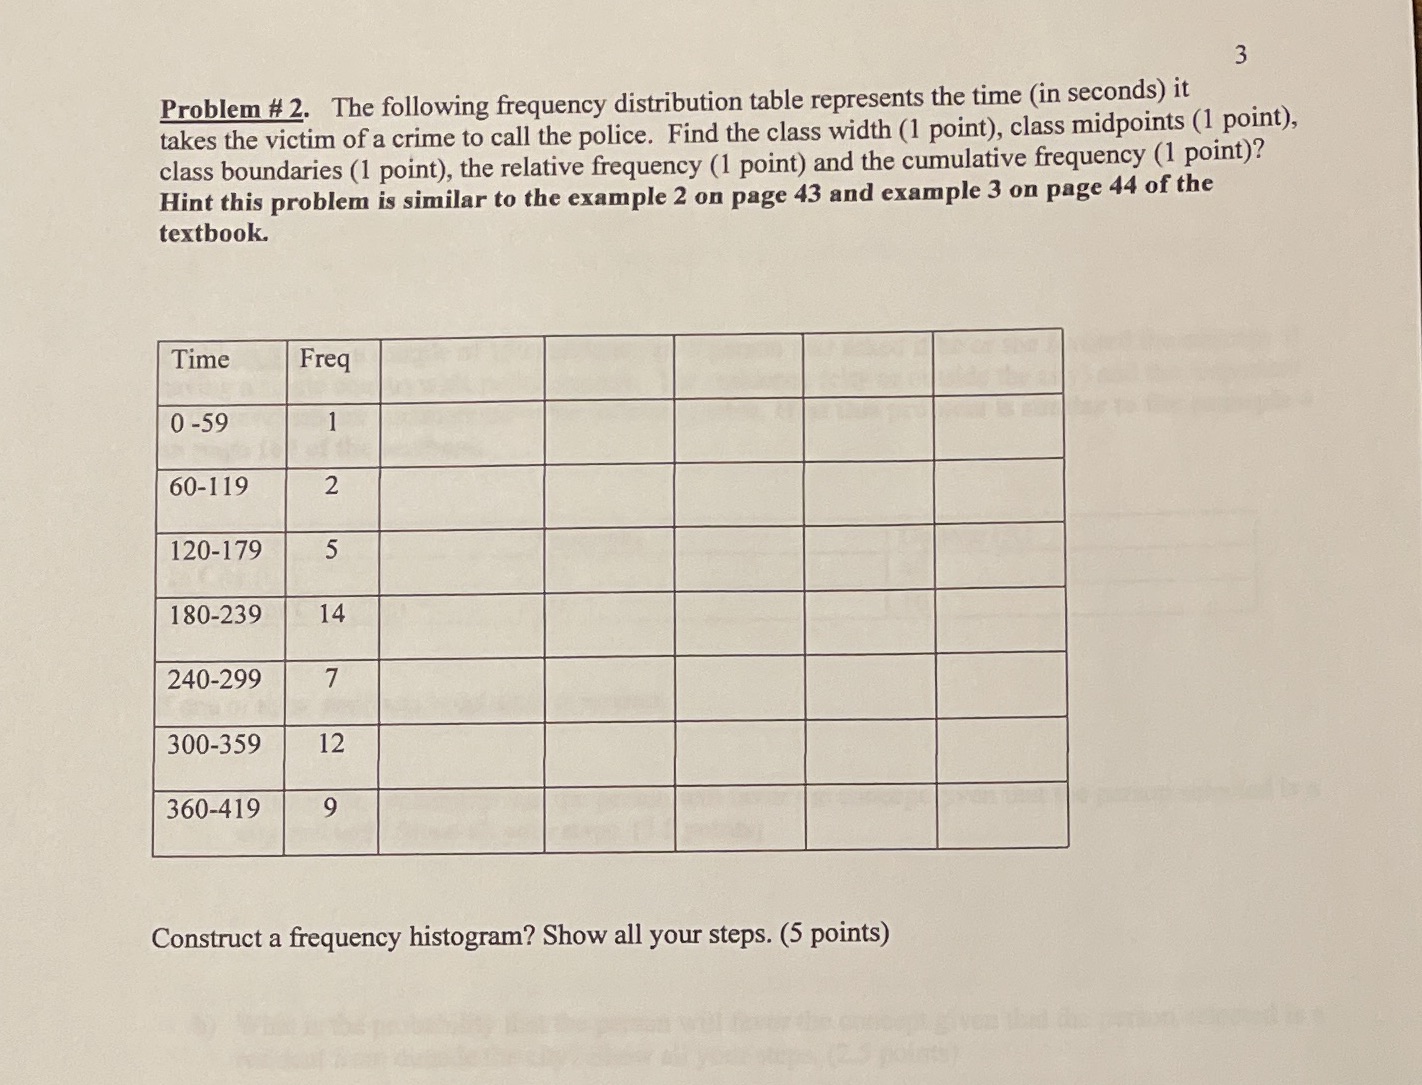
3 Problem # 2. The following frequency distribution table represents the time (in seconds) it takes the victim of a crime to call the police. Find the class width (1 point), class midpoints (1 point), class boundaries (1 point), the relative frequency (1 point) and the cumulative frequency (1 point)? Hint this problem is similar to the example 2 on page 43 and example 3 on page 44 of the textbook. Time Freq 0-59 60-119 2 120-179 5 180-239 14 240-299 7 300-359 12 360-419 9 Construct a frequency histogram? Show all your steps. (5 points)
Step by Step Solution
There are 3 Steps involved in it
1 Expert Approved Answer
Step: 1 Unlock

Question Has Been Solved by an Expert!
Get step-by-step solutions from verified subject matter experts
Step: 2 Unlock
Step: 3 Unlock