

Question: 3. Regarding the 3rd question, you need to indicate a straight line that separates positive and negative examples. 4. Regarding the 4th question, you need
3. Regarding the 3rd question, you need to indicate a straight line that separates positive and negative examples. 4. Regarding the 4th question, you need to show the margin on the 2D plot. 5. Regarding the 5th question, you need to explain how the prediction is done by looking at the 2D plot.
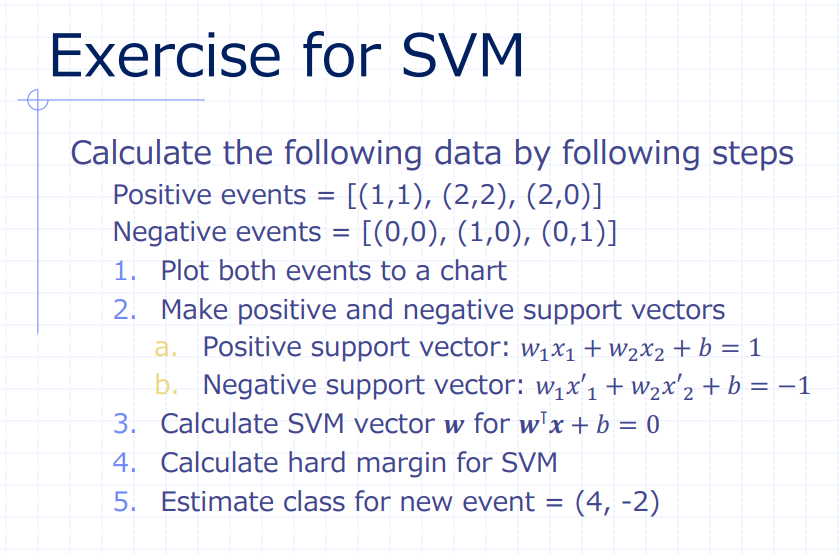
Exercise for SVM Calculate the following data by following steps Positive events =[(1,1),(2,2),(2,0)] Negative events =[(0,0),(1,0),(0,1)] 1. Plot both events to a chart 2. Make positive and negative support vectors a. Positive support vector: w1x1+w2x2+b=1 b. Negative support vector: w1x11+w2x2+b=1 3. Calculate SVM vector w for wx+b=0 4. Calculate hard margin for SVM 5. Estimate class for new event =(4,2)
Step by Step Solution
There are 3 Steps involved in it

Get step-by-step solutions from verified subject matter experts