

Question: 3 Required information Problem 17-2A Ratios, common-size statements, and trend percents LO P1, P2, P:3 The following information applies to the questions displayed below) Selected
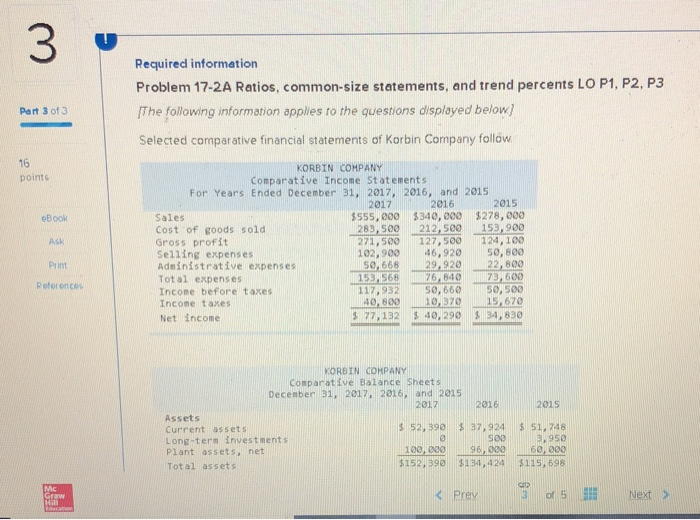
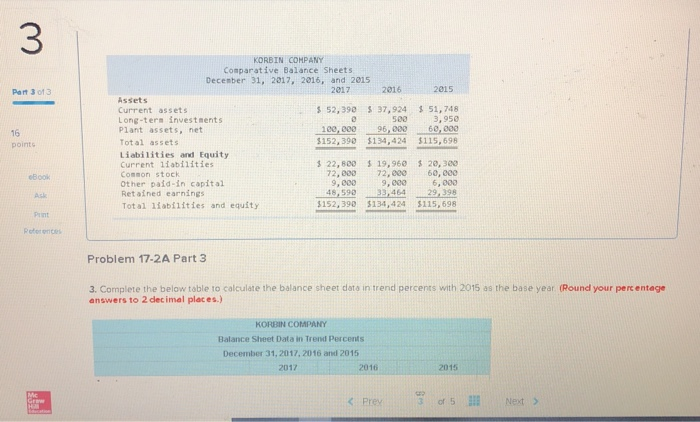
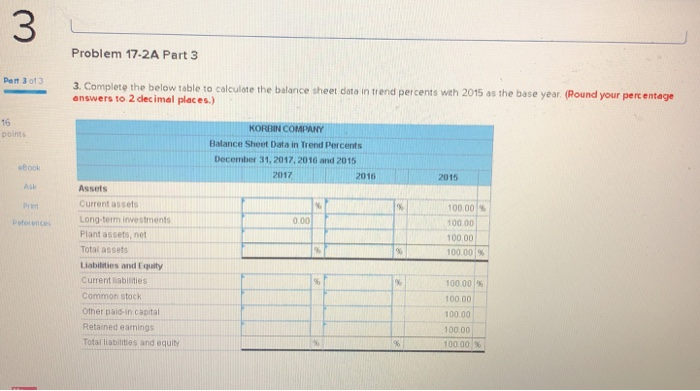
3 Required information Problem 17-2A Ratios, common-size statements, and trend percents LO P1, P2, P:3 The following information applies to the questions displayed below) Selected comparative financial statements of Korbin Company follow Part 3 of 3 16 pointe KORBIN COHPANY Conparative Income Statements For Years Ended December 31, 2017, 2016, and 2015 2016 $555,000 $340, ooo $278,000 283,500212, 500 153,900 271, 500 127,500 124,100 102,900 46, 920 50, 800 50,668 29,9222,800 76,840 117,932 50,66050, 500 40, 800 o,370 15,670 S 77, 132 $40,290 34,830| 2017 2015 eBook Ask Print Pofer once Sales Cost of goods sold Gross profit Selling expenses Adninistrative expenses Tot al expenses Income before taxes Incone taxes Net income 153.568 3,600 : KORBIN COMPANY Comparative Balance Sheets Decenber B1, 2017, 2016, and 2015 2017 2016 2015 Assets Current assets Long term invest ments $ 52, 390 $ 37, 924 $ 51, 748 3,950 60, 000 $152, 390 $134, 424 $115, 698 500 96, 000 100, 000 Plant assets, net Total assets Mc 3 Problem 17-2A Part3 Pen 3 o1:3 3. Complete the below table to calculate the balance sheet dsto in trend percents wah 2015 as the base year (Round your perc entage 16 points KORBIN COMPANY Balance Sheet Data in Trend Percents December 31, 2017, 2016 and 2015 2017 eBook 2016 2015 Ask Assets Current assets 100 00 % 100.00 100.00 10000% terence Long term investments 0.00 Plant assets, net Total assets Liabilities and Equity Current iabilities Common stock Other paid-in capital Retained earnings Total liabilities and equity 100 001% 100,00 100.00 100.00 00%
Step by Step Solution
There are 3 Steps involved in it

Get step-by-step solutions from verified subject matter experts