

Question: 3) Researchers are testing a new program for children who are learning to read. Each child is randomly assigned to either the treatment group or
3) Researchers are testing a new program for children who are learning to read. Each child is randomly assigned to either the treatment group or a control group, and reading ability is measured using a variable that is appropriately analyzed as continuous. All assumptions of the t-test are met.
But alas - I spilled my wine over the t-statistic and was so preoccupied with the mess that I forgot to provide the Pvalue to supplement the analysis.
a) What statistical test was conducted? Is there a statistically significant difference between the groups? Can you calculate and comment on the magnitude of the t-statistic? What is the null hypothesis for this research question and what will you do with it?
Summarize the research in no more than three sentences and include a proper interpretation of the 95% confidence interval.
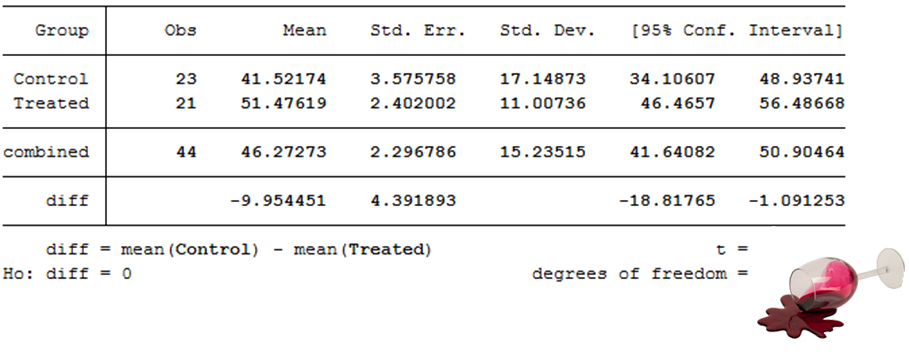
Group Obs Mean Std. Err. Std. Dev. [95% Conf. Interval] Control 23 41 . 52174 3. 575758 17. 14873 34. 10607 48 . 93741 Treated 21 51 . 47619 2 . 402002 11 . 00736 46 . 4657 56. 48668 combined 44 46.27273 2.296786 15. 23515 41 . 64082 50 . 90464 diff -9.954451 4. 391893 -18.81765 -1. 091253 diff = mean (Control) - mean (Treated) t= Ho: diff = 0 degrees of freedom =
Step by Step Solution
There are 3 Steps involved in it

Get step-by-step solutions from verified subject matter experts