

Question: 3. Run a simple linear regression using EXCEL Use Time period and Stock 1 prices. Show the output from Excel ( note the weeks must
3. Run a simple linear regression using EXCEL
- Use Time period and Stock 1 prices. Show the output from Excel ( note the weeks must be changed to time periods 1,2,3...)
- Set up the linear regression equation Stock 1
- Test the significance using p-value with =0.05. Stock 1
- Use Linear regression equation (from b) forecast the stock price for end of May 2022. Stock 1.
- Draw Time-series plot for Stock 1
- Do you notice any trends in e)? How would you adjust your forecast above in Q d)?

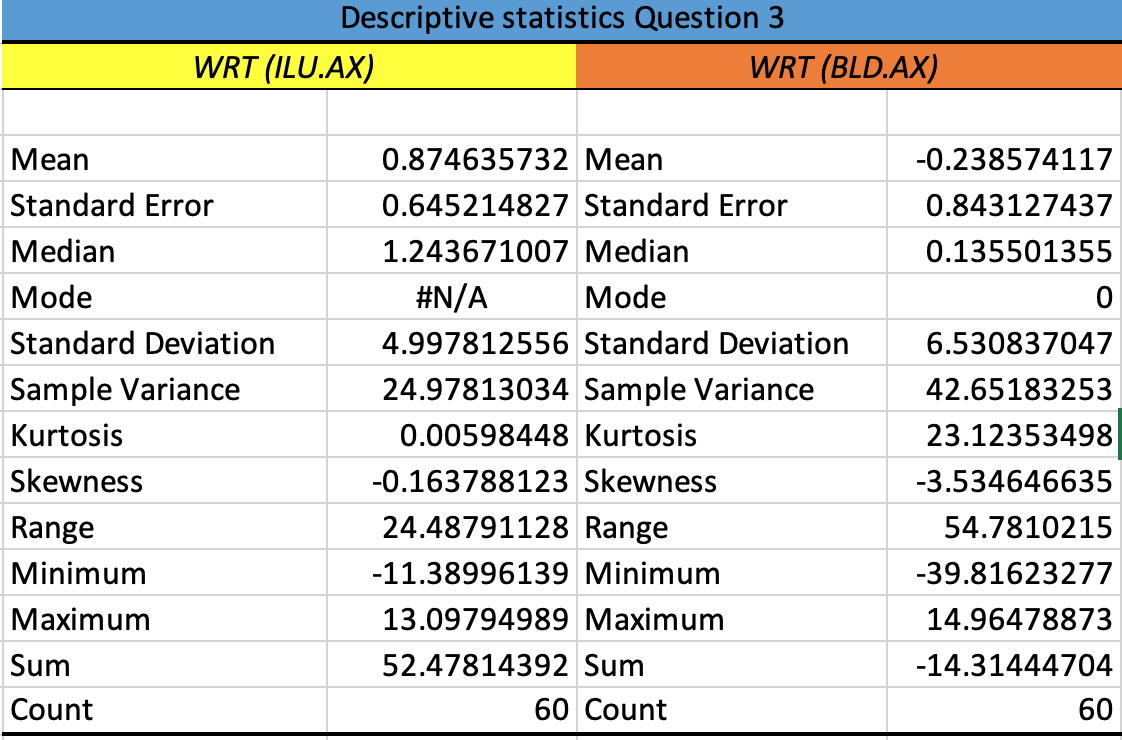
Descriptive statistics Question 3 WRT (ILU.AX) WRT (BLD.AX) Mean 0.874635732 Mean -0.238574117 Standard Error 0.645214827 Standard Error 0.843127437 Median 1.243671007 Median 0.135501355 Mode #N/A Mode 0 Standard Deviation 4.997812556 Standard Deviation 6.530837047 Sample Variance 24.97813034 Sample Variance 42.65183253 Kurtosis 0.00598448 Kurtosis 23.12353498 Skewness -0.163788123 Skewness -3.534646635 Range 24.48791128 Range 54.7810215 Minimum -11.38996139 Minimum -39.81623277 Maximum 13.09794989 Maximum 14.96478873 Sum 52.47814392 Sum -14.31444704 Count 60 Count 60
Step by Step Solution
There are 3 Steps involved in it
1 Expert Approved Answer
Step: 1 Unlock

Question Has Been Solved by an Expert!
Get step-by-step solutions from verified subject matter experts
Step: 2 Unlock
Step: 3 Unlock