

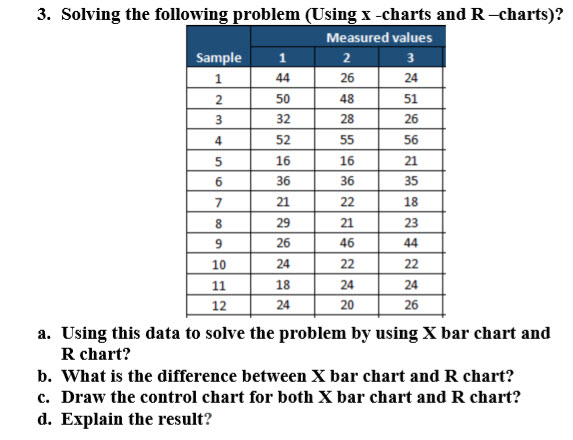
Question: 3. Solving the following problem (Using X-charts and R-charts)? Measured values Sample 2 3 1 1 44 26 24 2 50 48 51 3 28
Step by Step Solution
There are 3 Steps involved in it
1 Expert Approved Answer
Step: 1 Unlock

Question Has Been Solved by an Expert!
Get step-by-step solutions from verified subject matter experts
Step: 2 Unlock
Step: 3 Unlock