

Question: 3. (Spreadsheet provided) Two alternative mosquito control programs have been propose the next five years. The costs and effectiveness of each program in each of
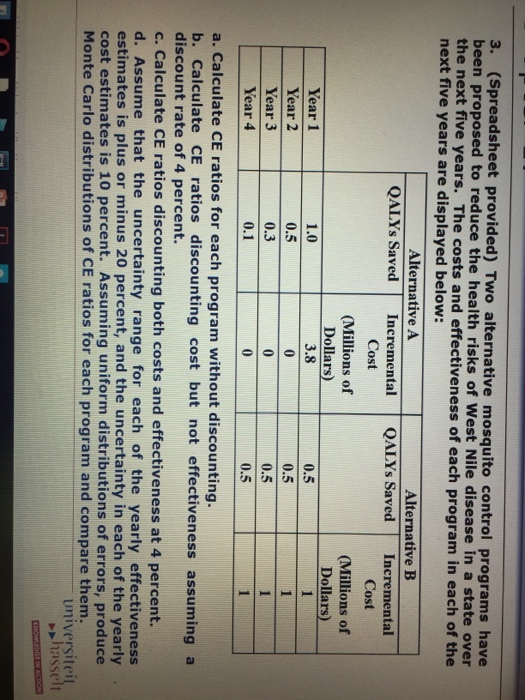
3. (Spreadsheet provided) Two alternative mosquito control programs have been propose the next five years. The costs and effectiveness of each program in each of the next five years are displayed below: d to reduce the health risks of West Nile disease in a state over Alternative A Alternative B QALYs Saved Incremental s Saved Incremental Cost (Millions of Dollars) 3.8 0 Cost Millions of Dollars) Year 1 Year 2 Year 3 1.0 0.5 | 0.3 0.1 0.5 0.5 0.5 0.5 a. Calculate CE ratios for each program without discounting. b. Calculate CE ratios discounting cost but not effectiveness assuming a discount rate of 4 percent. c. Calculate CE ratios discounting both costs and effectiveness at 4 percent. d. Assume that the uncertainty range for each of the yearly effectiveness estimates is plus or minus 20 percent, and the uncertainty in each of the yearly cost estimates is 10 percent. Assuming uniform distributions of errors, produce Monte Carlo distributions of CE ratios for each program and compare them, universitei 3. (Spreadsheet provided) Two alternative mosquito control programs have been propose the next five years. The costs and effectiveness of each program in each of the next five years are displayed below: d to reduce the health risks of West Nile disease in a state over Alternative A Alternative B QALYs Saved Incremental s Saved Incremental Cost (Millions of Dollars) 3.8 0 Cost Millions of Dollars) Year 1 Year 2 Year 3 1.0 0.5 | 0.3 0.1 0.5 0.5 0.5 0.5 a. Calculate CE ratios for each program without discounting. b. Calculate CE ratios discounting cost but not effectiveness assuming a discount rate of 4 percent. c. Calculate CE ratios discounting both costs and effectiveness at 4 percent. d. Assume that the uncertainty range for each of the yearly effectiveness estimates is plus or minus 20 percent, and the uncertainty in each of the yearly cost estimates is 10 percent. Assuming uniform distributions of errors, produce Monte Carlo distributions of CE ratios for each program and compare them, universitei
Step by Step Solution
There are 3 Steps involved in it

Get step-by-step solutions from verified subject matter experts