

Question: 3. Stock Valuation (7 points) a.) Using year 2018 data, what was the common dividends paid per share? (2 points) b.) The price of the
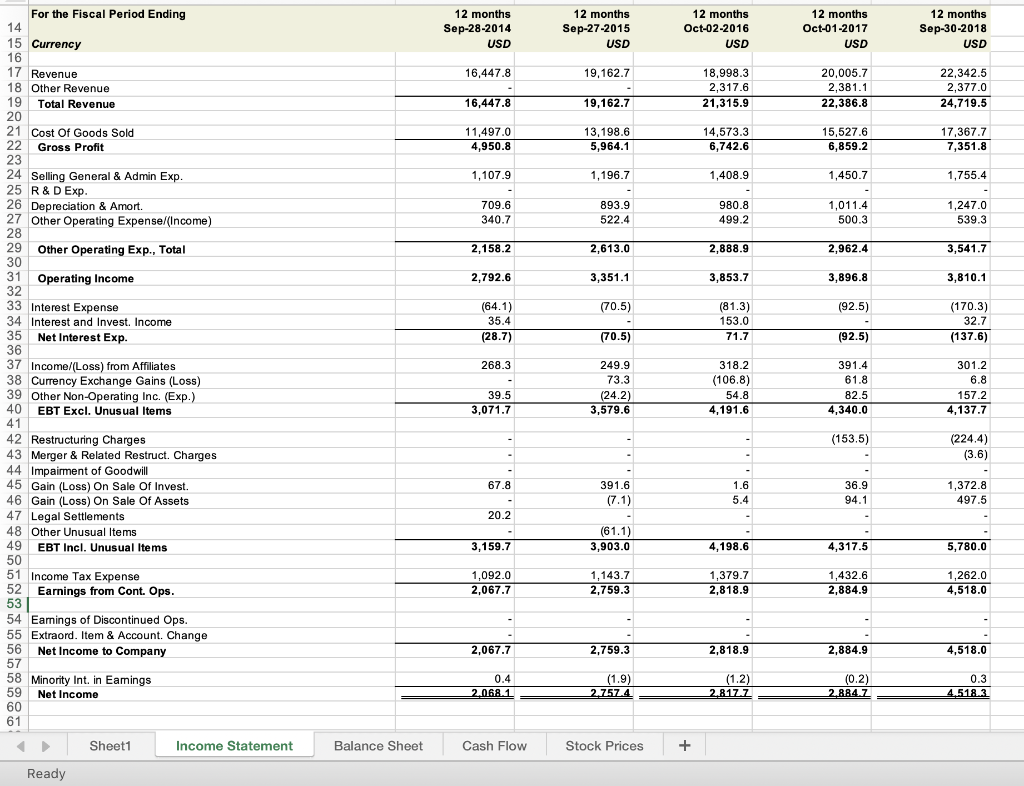
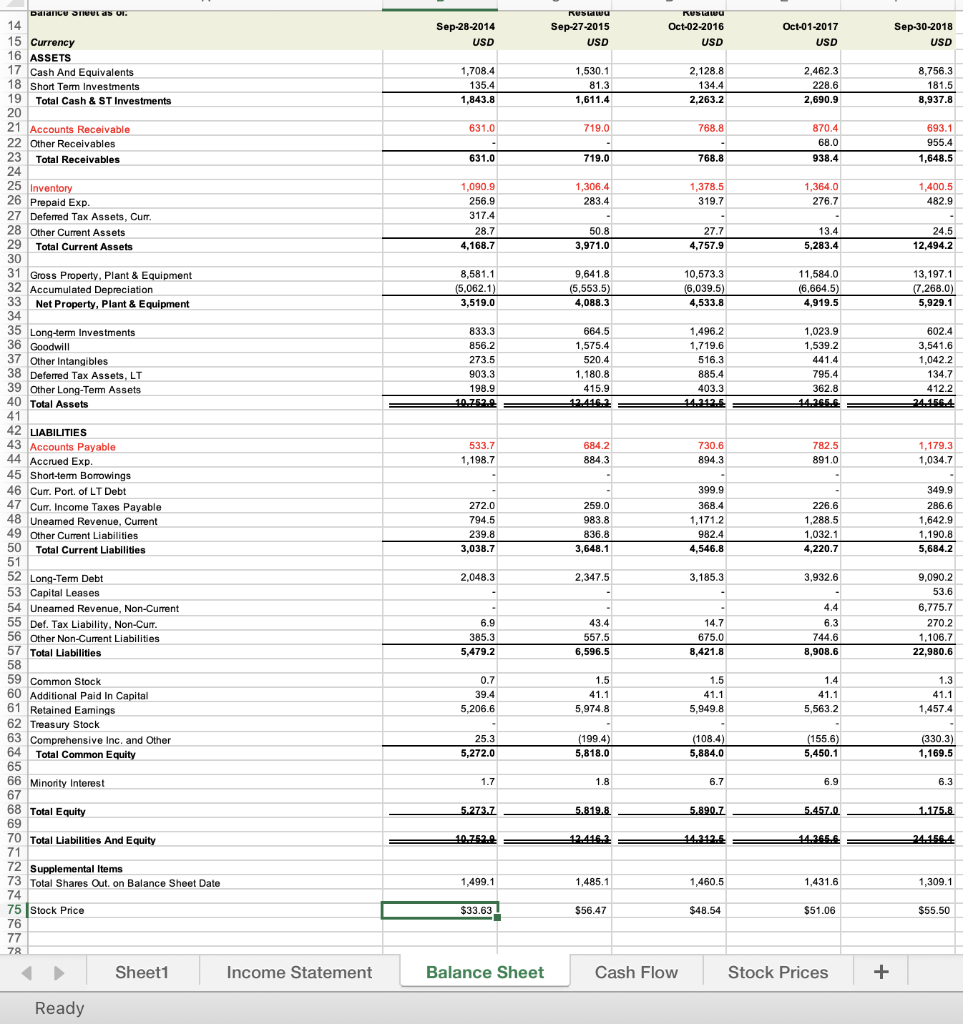
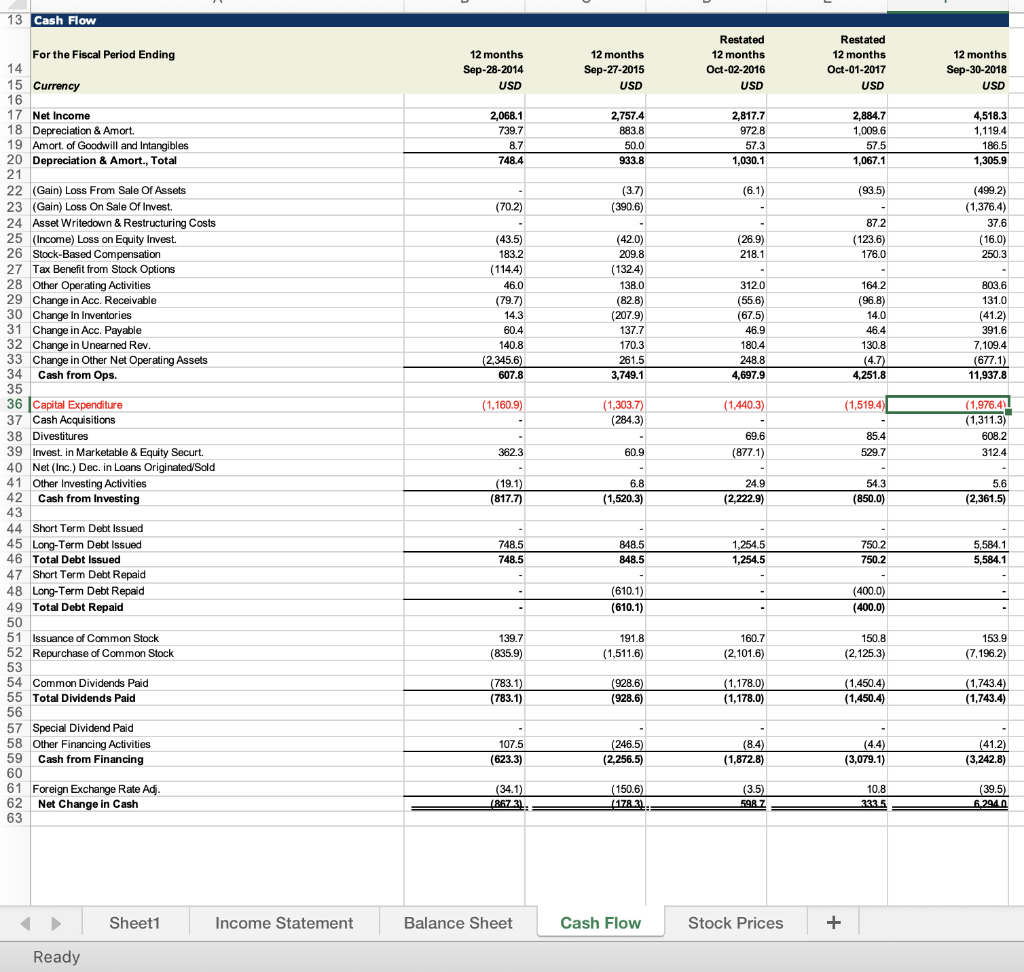
3. Stock Valuation (7 points) a.) Using year 2018 data, what was the common dividends paid per share? (2 points) b.) The price of the stock at the beginning of 2018 was $56.81 and you sold the stock at $68.14 at the end of the year. What is the dividend yield (use your answer from 3a above), capital gain(loss), and total percentage return? (2 points) I c.) If the dividend calculated in 3a above is expected to grow by 2.5% for the next three years, and then grow by 1% in perpetuity afterwards, and the expected return on the stock is 8%, what is the value of the stock today? (6 points) For the Fiscal Period Ending 14 12 months Sep-28-2014 USD 12 months Sep-27-2015 USD 12 months Oct-02-2016 USD 12 months Oct-01-2017 USD 12 months Sep-30-2018 USD 15 Currency 16,447.8 19,162.7 18,998.3 2,317.6 21,315.9 20,005.7 2,381.1 22,386.8 22,342.5 2,377.0 24,719.5 16,447.8 19,162.7 11,497.0 4,950.8 13,198.6 5,964.1 14,573.3 6,742.6 15,527.6 6,859.2 17,367.7 7,351.8 1,107.9 1,196.7 1,408.9 1,450.7 1,755.4 709.6 340.7 893.9 522.4 980.8 499.2 1,011.4 500.3 1,247.0 539.3 2,158.2 2,613.0 2,888.9 2,962.4 3,541.7 2,792.6 3,351.1 3,853.7 3,896.8 3,810.1 (92.5) (64.1) 35.4 (28.7) (70.5) - (70.5) (81.3) 153.0 71.7 (170.3) 32.7 (137.6) (92.5) 16 17 Revenue 18 Other Revenue 19 Total Revenue 20 21 Cost Of Goods Sold 22 Gross Profit 23 24 Selling General & Admin Exp. 25 R & D Exp. 26 Depreciation & Amort. 27 Other Operating Expense/(Income) 28 29 Other Operating Exp., Total 30 31 Operating Income 32 33 Interest Expense 34 Interest and Invest. Income 35 Net Interest Exp. 36 37 Income/(Loss) from Affiliates 38 Currency Exchange Gains (Loss) 39 Other Non-Operating Inc. (Exp.) 40 EBT Excl. Unusual Items 41 42 Restructuring Charges 43 Merger & Related Restruct. Charges 44 Impairment of Goodwill 45 Gain (Loss) On Sale Of Invest. 46 Gain (Loss) On Sale Of Assets 47 Legal Settlements 48 Other Unusual Items 49 EBT Incl. Unusual Items 50 51 Income Tax Expense 52 Earnings from Cont. Ops 53 54 Earnings of Discontinued Ops. 55 Extraord. Item & Account Change 56 Net Income to Company 57 58 Minority Int. in Eamings 59 Net Income 60 61 268.3 - 39.5 3,071.7 249.9 73.3 (24.2) 3,579.6 318.2 (106.8) 54.8 4,191.6 391.4 61.8 82.5 4,340.0 301.2 6.8 157.2 4,137.7 (153.5) (224.4) (3.6) 67.8 391.6 (7.1) - 1.6 5.4 36.9 94.1 1,372.8 497.5 20.2 (61.1) 3,903.0 3,159.7 4,198.6 4,317.5 5,780.0 1,092.0 2,067.7 1,143.7 2,759.3 1,379.7 2,818.9 1,432.6 2,884.9 1,262.0 4,518.0 2,067.7 2,759.3 2,818.9 2,884.9 4,518.0 0.4 2.168.1 (1.9) 2.757.4 (1.2) 2.817.7 (0.2) 2.884.7 0.3 4.518.3 Sheet1 Income Statement Balance Sheet Cash Flow Stock Prices + Ready RUSU Sep-27-2015 USD Rustawu Oct-02-2016 Sep-28-2014 USD Oct-01-2017 USD Sep-30-2018 USD USD 1,708.4 135.4 1,843.8 1,530.1 81.3 1,611.4 2,128.8 134.4 2,263.2 2.462.3 228.6 2,690.9 8,756.3 181.5 8,937.8 631.0 719.0 768.8 870.4 68.0 938.4 693.1 955.4 1,648.5 631.0 719.0 768.8 1,378.5 319.7 1,364.0 276.7 1,400.5 482.9 1,090.9 256.9 317.4 28.7 4,168.7 1,306.4 283.4 - 50.8 3.971.0 27.7 4,757.9 13.4 5,283.4 24.5 12,494.2 8,581.1 (5,062.1) 3,519.0 9,641.8 (5,553.5) 4,088.3 10,573.3 (6.039.5) 4,533.8 11,584.0 (6,664.5) 4,919.5 13,197.1 (7.268.0) 5,929.1 833.3 856.2 273.5 903.3 198.9 10.752. 664.5 1,575.4 520.4 1,180.8 415.9 12416..2 1,496.2 1,719.6 516.3 885.4 403.3 14.2.2 1,023.9 1,539.2 441.4 795.4 362.8 14.26... 602.4 3,541.6 1,042.2 134.7 412.2 24.-15.6.4 533.7 1,198.7 684.2 884.3 730.6 894.3 782.5 891.0 1,179.3 1,034.7 Dalance sheet as on 14 15 Currency 16 ASSETS 17 Cash And Equivalents 18 Short Term Investments 19 Total Cash & ST Investments 20 21 Accounts Receivable 22 Other Receivables 23 Total Receivables 24 25 Inventory 26 Prepaid Exp. 27 Deferred Tax Assets, Curr. 28 Other Current Assets 29 Total Current Assets 30 31 Gross Property. Plant & Equipment 32 Accumulated Depreciation 33 Net Property, Plant & Equipment 34 35 Long-term Investments 36 Goodwill 37 Other Intangibles 38 Deferred Tax Assets, LT 39 Other Long-Term Assets 40 Total Assets 41 42 LIABILITIES 43 Accounts Payable 44 Accrued Exp. 45 Short-term Borrowings 46 Curr. Port of LT Debt 47 Curr. Income Taxes Payable 48 Uneamed Revenue, Current 49 Other Current Liabilities 50 Total Current Liabilities 51 52 Long-Term Debt 53 Capital Leases 54 Uneamed Revenue, Non-Current 55 Def. Tax Liability. Non-Curr. 56 Other Non-Current Liabilities 57 Total Liabilities 58 59 Common Stock 60 Additional Paid In Capital 61 Retained Earnings 62 Treasury Stock 63 Comprehensive Inc. and Other 64 Total Common Equity 65 66 Minority Interest 67 68 Total Equity 69 70 Total Liabilities And Equity 71 72 Supplemental Items 73 Total Shares Out. on Balance Sheet Date 74 75 Stock Price 76 77 78 Sheet1 272.0 794.5 239.8 3,038.7 259.0 983.8 836.8 3,648.1 399.9 368.4 1,171.2 982.4 4,546.8 226.6 1,288.5 1.032.1 4,220.7 349.9 286.6 1,642.9 1,190.8 5,684.2 2,048.3 2,347.5 3,185,3 3,932.6 9,090.2 53.6 6,775.7 270.2 1,106.7 22,980.6 6.9 385.3 5,479.2 43.4 557.5 6,596.5 4.4 6.3 744.6 8,908.6 14.7 675.0 8,421.8 0.7 39.4 5,206.6 1.5 41.1 5,974.8 1.4 41.1 5,563.2 1.3 41.1 1,457.4 1.5 41.1 5,949.8 - (108.4) 5,884.0 25.3 5,272.0 (199.4) 5,818.0 (155.6) 5,450.1 (330.3) 1,169.5 1.7 1.8 6.7 6.9 6.3 5.273.7 5.819.8 5.890.7 5.457.0 1.175.8 10.752.0 14.2.2.5 14.26.5.6. -24_156.4 1,499.1 1,485.1 1,460.5 1,431.6 1,309.1 $33.63 $56.47 $48.54 $51.06 $55.50 Income Statement Balance Sheet Cash Flow Stock Prices + Ready 13 Cash Flow For the Fiscal Period Ending 14 12 months Sep-28-2014 USD 12 months Sep-27-2015 USD Restated 12 months Oct-02-2016 USD Restated 12 months Oct-01-2017 USD 12 months Sep-30-2018 USD 2,068.1 739.7 8.7 748.4 2,757.4 883.8 50.0 933.8 2,817.7 972.8 57.3 1,030.1 2,884.7 1,009,6 57.5 1,067.1 4,518.3 1,119.4 186.5 1,305.9 (3.7) ) (390.6) (6.1) (93.5) (70.2) 872 (499.2) (1,376.4) 37.6 (16.0) 250.3 (26.9) 218.1 (123.6) 176.0 (43.5) 183.2 (114.4) ( 46.0 (79.7) 14.3 60.4 140.8 (2,345.6) 607.8 (42.0) 209.8 (1324) 138.0 (82.8) (207.9) 137.7 170.3 261.5 3,749.1 312.0 (55.6) (67.5) 46.9 180.4 248.8 4,697.9 164.2 (96.8) 14.0 46.4 130.8 (4.7) 4,251.8 803.6 131.0 (41.2) 391.6 7,109.4 (677.1) 11,937.8 (1.160.9) (1,440.3) (1,519.4) (1,976.41 (1,303.7) (284.3) 15 Currency 16 17 Net Income 18 Depreciation & Amort. 19 Amort of Goodwill and Intangibles 20 Depreciation & Amort., Total 21 22 (Gain) Loss From Sale Of Assets ( 23 (Gain) Loss On Sale Of Invest. 24 Asset Writedown & Restructuring Costs 25 (Income) Loss on Equity Invest. 26 Stock-Based Compensation 27 Tax Benefit from Stock Options 28 Other Operating Activities 29 Change in Acc. Receivable 30 Change In Inventories 31 Change in Acc. Payable 32 Change in Unearned Rev. 33 Change in Other Net Operating Assets 34 Cash from Ops. 35 36 Capital Expenditure 37 Cash Acquisitions 38 Divestitures 39 Invest. in Marketable & Equity Securt. 40 Net (Inc.) Dec. in Loans Originated Sold 41 Other Investing Activities 42 Cash from Investing 43 44 Short Term Debt Issued 45 Long-Term Debt Issued 46 Total Debt Issued 47 Short Term Debt Repaid 48 Long-Term Debt Repaid 49 Total Debt Repaid 50 51 Issuance of Common Stock 52 Repurchase of Common Stock 53 54 Common Dividends Paid 55 Total Dividends Paid 56 57 Special Dividend Paid 58 Other Financing Activities 59 Cash from Financing 60 61 Foreign Exchange Rate Adj. 62 Net Change in Cash 63 69.6 (877.1) 85.4 529.7 (1,311.3) 608.2 3124 362.3 60.9 (19.1) (817.7) 6.8 (1,520.3) 24.9 (2,222.9) 54.3 (850.0) 5.6 (2,361.5) 748.5 748.5 848.5 848.5 1.254.5 1,254.5 750.2 750.2 5,584.1 5,584.1 (610.1) (610.1) (400.0) (400.0) 139.7 (835.9) 191.8 (1,511.6) 160.7 (2,101.6) 150.8 (2.125.3) 153.9 (7,196.2) (783.1) (783.1) (928.6) (928.6) (1,178.0) (1,178.0) (1,450.4 (1,450.4) (1,743.4) (1,743.4) 107.5 (623.3) (246.5) (2,256.5) (8.4) (1,872.8) (41.2) (3,242.8) (3,079.1) (34.1) (867.31 (150.6) (39.5) (3.5) 598.7 10.8 333.5 178.31 6.2940 Sheet1 Income Statement Balance Sheet Cash Flow Stock Prices + Ready
Step by Step Solution
There are 3 Steps involved in it

Get step-by-step solutions from verified subject matter experts