

Question: 3. Submit at least a one page written analysis for each financial statement. The report should be well written using appropriate business/accounting vocabulary. Comment on
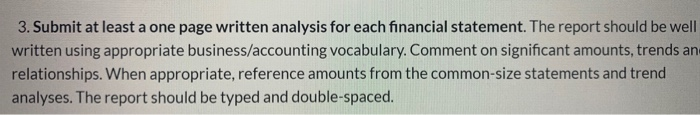
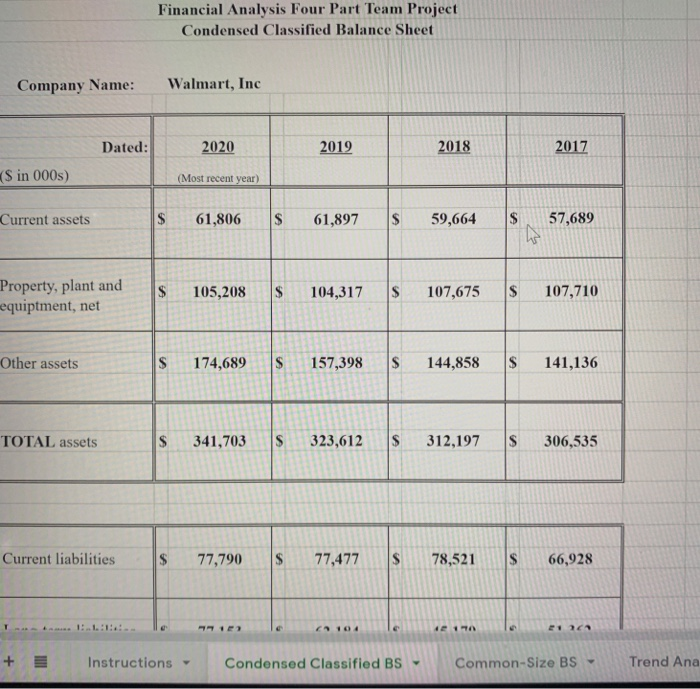
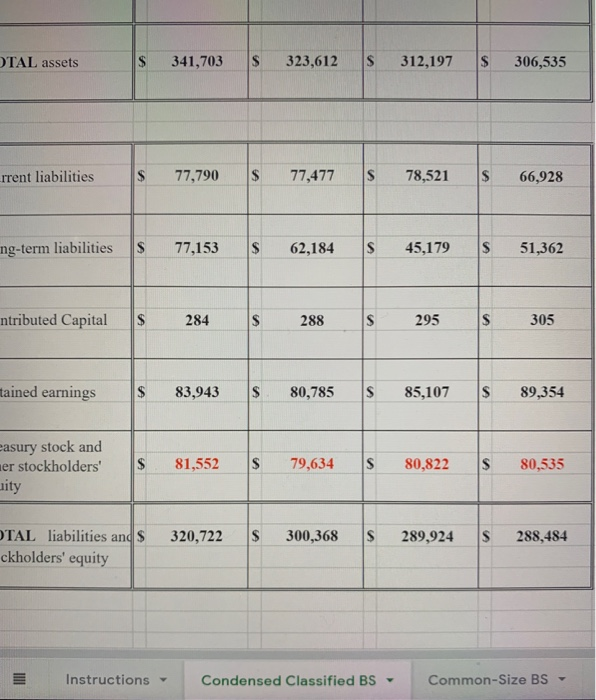
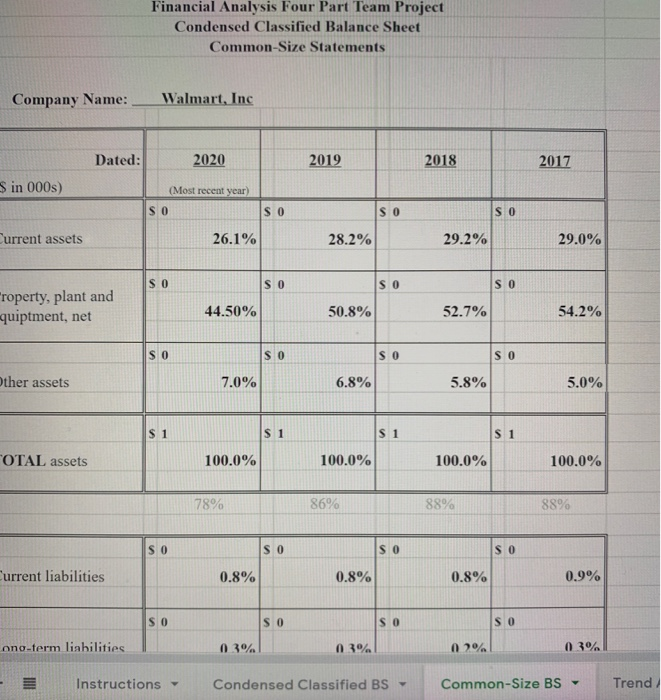
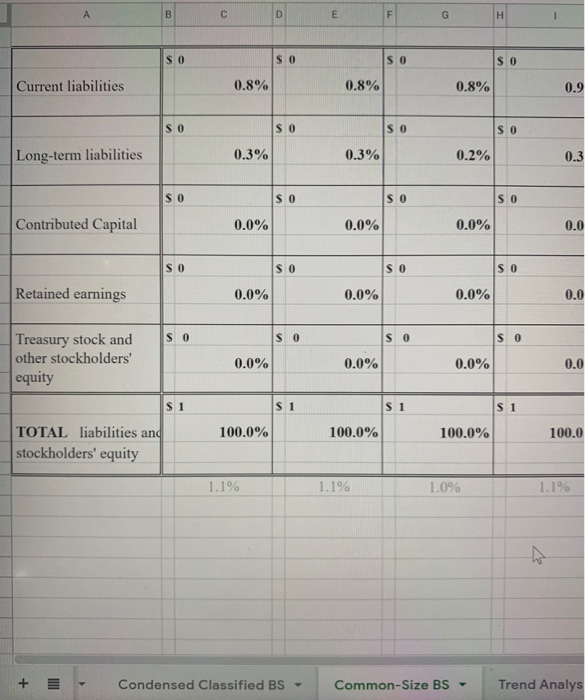
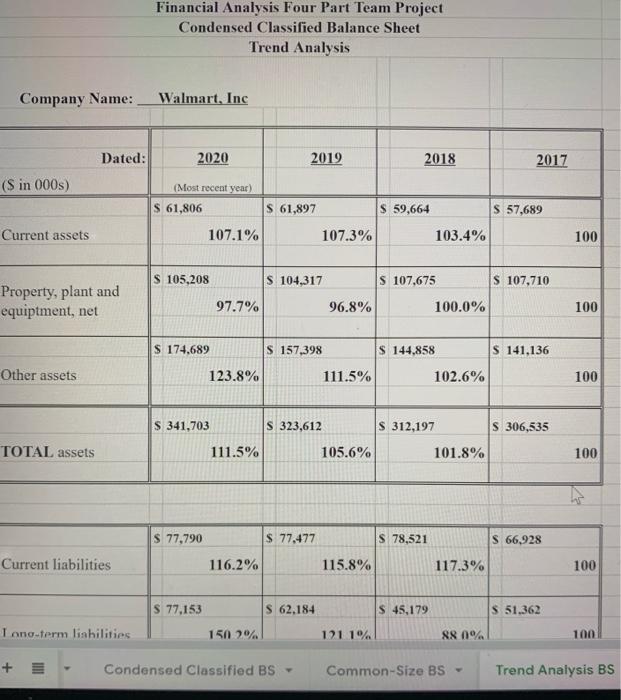
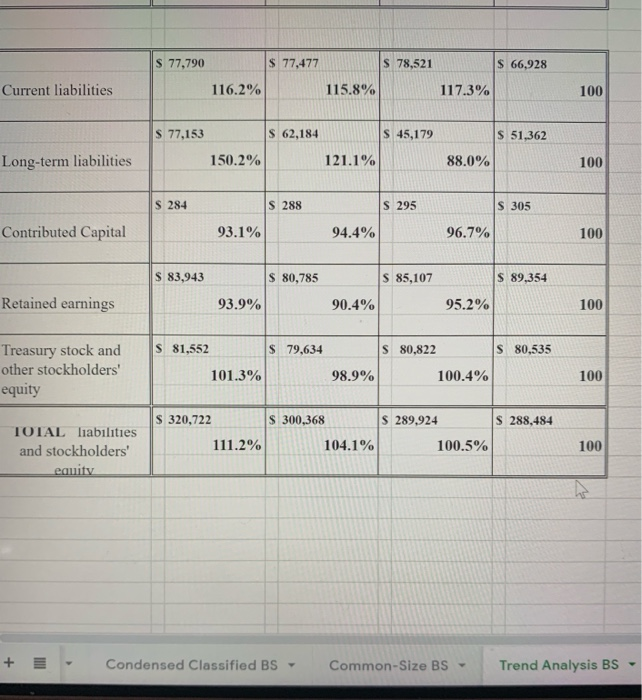
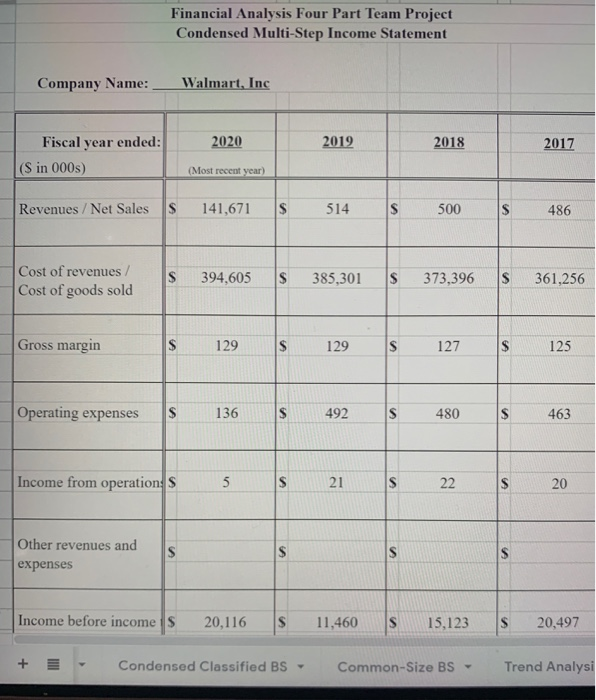
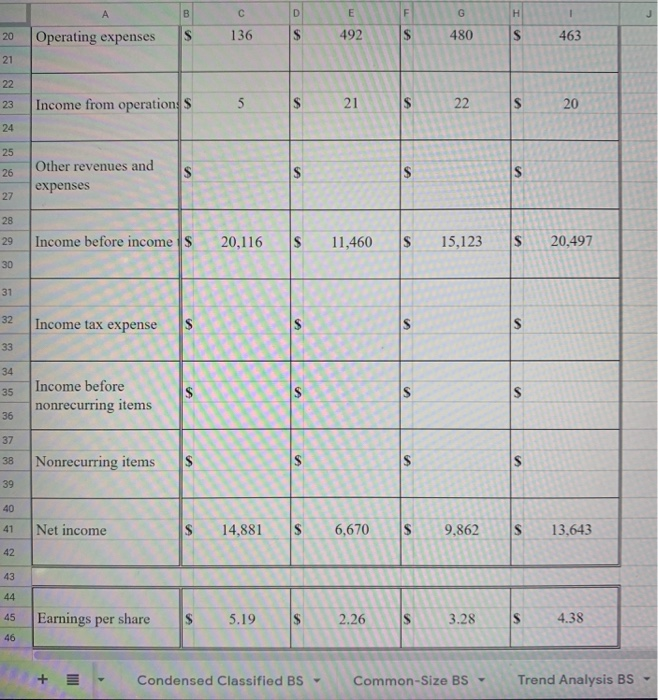
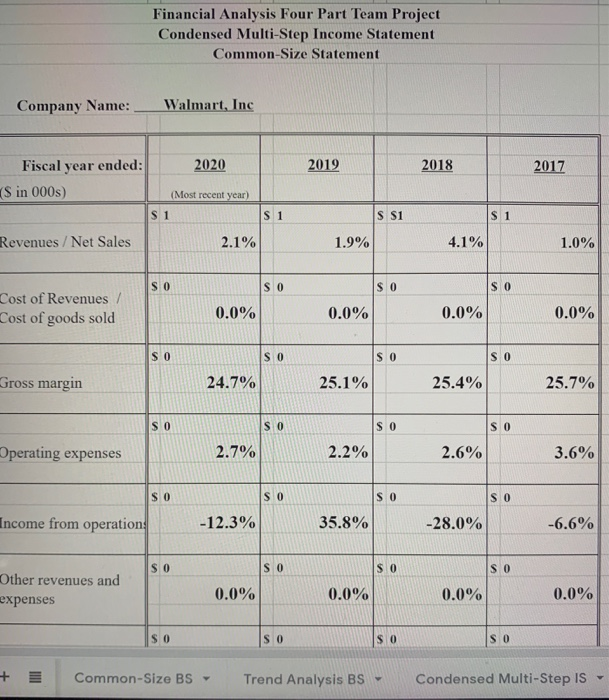
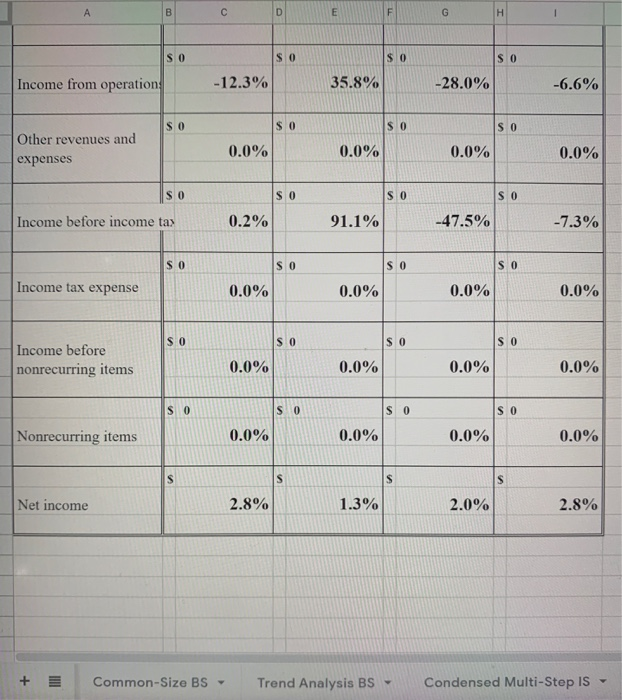
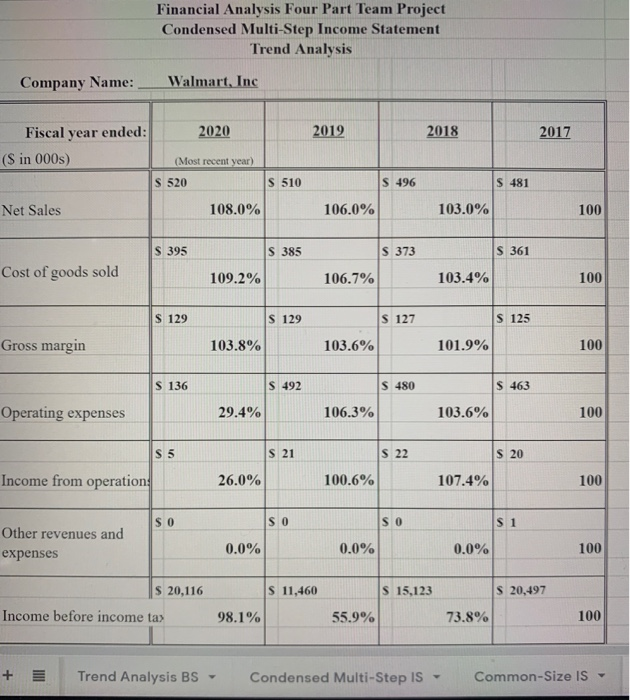
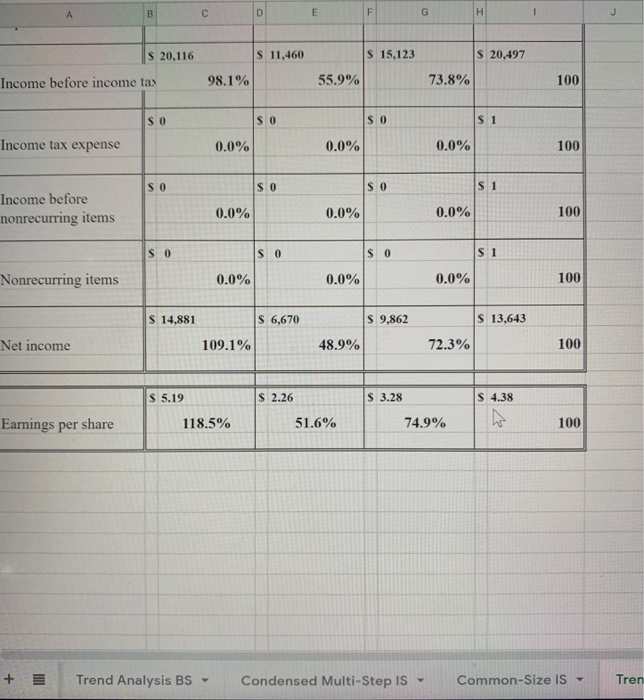
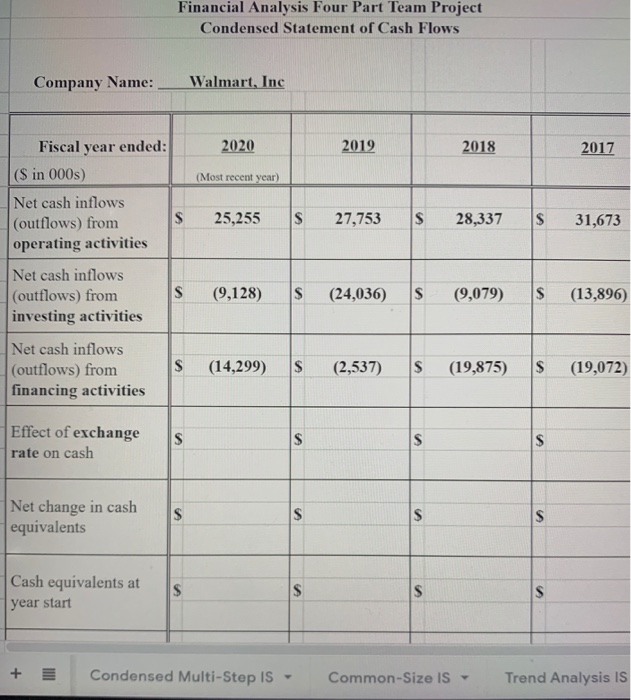
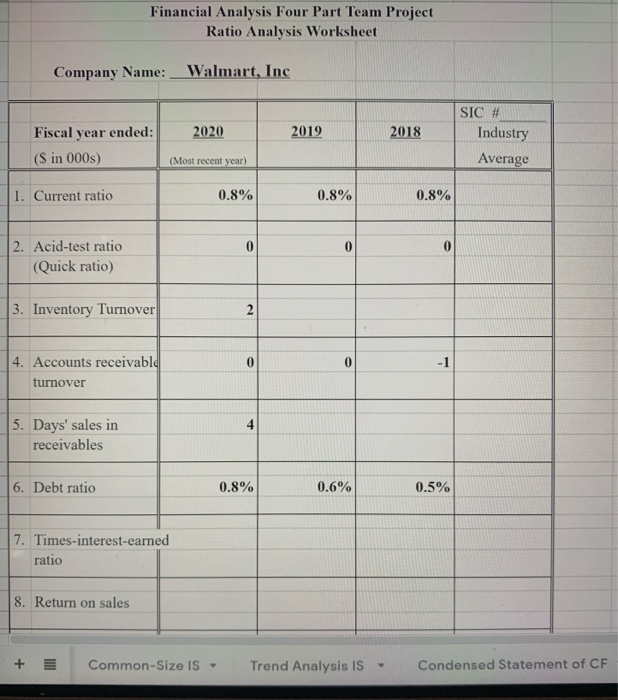
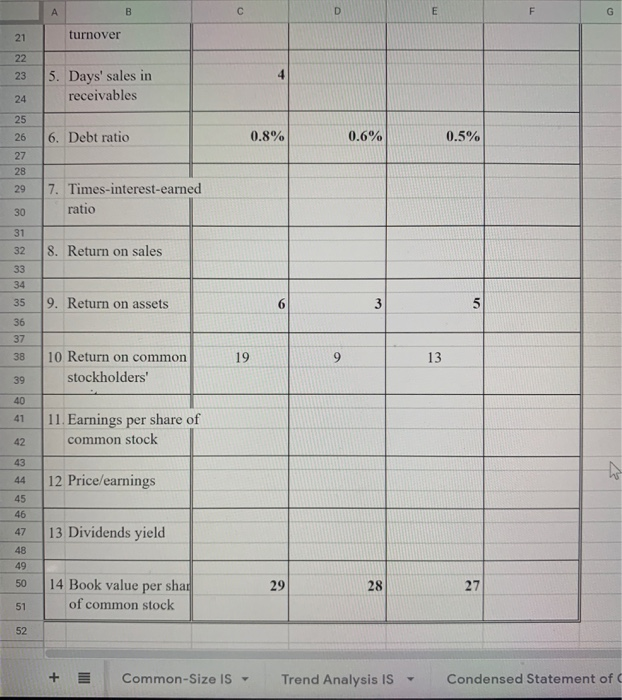
3. Submit at least a one page written analysis for each financial statement. The report should be well written using appropriate business/accounting vocabulary. Comment on significant amounts, trends an relationships. When appropriate, reference amounts from the common-size statements and trend analyses. The report should be typed and double-spaced. Financial Analysis Four Part Team Project Condensed Classified Balance Sheet Company Name: Walmart, Inc Dated: 2020 2019 2018 2017 ($ in 000) (Most recent year) Current assets 61,806 $ 61,897 $ 59,664 $ 57,689 Property, plant and equiptment, net 104,317 $ 107,675 $ 107,710 Other assets 174,689 57,398 S 144,858 S 141,136 TOTAL assets $ 341,703s 323,612 312,197 S 306,535 Current liabilities $ 77,790 $ 77,477 $ 78,521 $ 66,928 Instructions Condensed Classified BS Common-Size BS- Trend Ana TAL assets $ 341,703 $ 323,612 S 312,197 $ 306,535 rrent liabilities $ 77,790 $ 77,477 S 78,521 $ 66,928 ng-term liabilities $ 77,153 $ 62,184 $ 45,179 $ 51,362 ntributed Capital $ 284 $ 288 S 295 $ 305 mained earnings $ 83,943 $ 80,785 S 85,107 89,354 easury stock and ner stockholders' nity $ 81,552 $ 79,634 S 80,822 80,535 320,722 $ 300,368 S 289,924 S 288,484 OTAL liabilities and $ ckholders' equity Instructions Condensed Classified BS Common-Size BS- Financial Analysis Four Part Team Project Condensed Classified Balance Sheet Common-Size Statements Company Name: Walmart, Inc Dated: 2020 2019 2018 2017 Sin 000s) (Most recent year) Current assets 26.1% 28.2% 29.2% 29.0% SO roperty, plant and quiptment, net 44.50% 50.8% 52.7% 54.2% Other assets 7.0% 6.8% 5.8% 5.0% S1 TOTAL assets 100.0% 100.0% 100.0% 100.0% 78% 86% 88% 88% Current liabilities 0.8% 0.8% 0.8% 0.9% ono-term liabilities 0.3% 1 30% Instructions Condensed Classified BS Common-Size BS Trend E F G H so SO 0.8% Current liabilities 0.8% 0.8% 0.9 0.9 Long-term liabilities 0.3% 0.3% 0.2% 0.3 so Contributed Capital 0.0% 0.0% 0.0% 0.0 SO Retained earnings 0.0% 0.0% 0.0% 0.0 So S 0 S 0 Treasury stock and other stockholders' equity 0.0% 0.0% 0.0% 100.0% 100.0% 100.0% 100.0 TOTAL liabilities and stockholders' equity 1% 1.0% 1.1% Condensed Classified BS- Common-Size BS Trend Analys Financial Analysis Four Part Team Project Condensed Classified Balance Sheet Trend Analysis Company Name: Walmart, Inc Dated: 2020 2019 2018 2017 (S in 000s) (Most recent year) S 61,806 S 61,897 S 59,664 S 57,689 Current assets 107.1% 107.3% 103.4% 100 $ 105,208 S 104,317 S 107,710 Property, plant and equipment, net S 107,675 100.0% 97.7% 96.8% 100 S 157,398 S 141,136 S 174,689 123.8% S 144,858 102.6% Other assets 111.5% 100 S 341,703 S 323,612 S 306,535 S 312,197 101.8% TOTAL assets 111.5% 105.6% 100 s 77,790 $ 77,477 S 78,521 S 66,928 Current liabilities 116.2% 115.8% 117.3% 100 S 77,153 S 62,184 51,362 S 45,179 E88 0% Long-term liabilities 150.2% 121.1% 100 + Condensed Classified BS Common-Size BS Trend Analysis BS S 77,790 S 78,521 $ 66,928 $ 77,477 115.8% Current liabilities 116.2% 117.3% 100 S 77,153 S 62,184 S 45,179 S 51,362 Long-term liabilities 150.2% 121.1% 88.0% 100 S 284 S 288 S 295 S 305 Contributed Capital 93.1% 94.4% 96.7% 100 S 83,943 S 80,785 S 85,107 $ 89,354 Retained earnings 93.9% 90.4% 95.2% 100 S 81,552 $ 79,634 S 80.822 S 80,535 Treasury stock and other stockholders' equity 101.3% 98.9% 100.4% 100 S 320,722 S 300,368 S 288,484 TOTAL liabilities and stockholders' S 289,924 100.5% 111.2% 104.1% 100 equity + - Condensed Classified BS Common-Size BS Trend Analysis BS Financial Analysis Four Part Team Project Condensed Multi-Step Income Statement Company Name: _ Walmart, Inc 2020 2019 2018 2017 Fiscal year ended: (S in 000) (Most recent year) Revenues / Net Sales S 141,671 S 514 $ 500 S 486 s Cost of revenues / Cost of goods sold 394,605 S 385,301 S 373,396 S 361,256 Gross margin 129 $ 129 127 $ 125 Operating expenses 136 $ 492 S 480 S 463 Income from operation S 5 S S 22 S 20 Other revenues and expenses Income before income is 20,116 $ 11,460 s 15.123 S 20,497 + Condensed Classified BS- Common-Size BS Trend Analysi C D G 480 H S 20 Operating expenses S 136 463 23 Income from operations $ 22 24 25 26 Other revenues and expenses 27 28 29 30 Income before income $ 20,116 $ 11,460 S 15,123 S 20,497 32 Income tax expense 33 35 Income before nonrecurring items 36 N 38 Nonrecurring items / / / 41 Net income G 9,862 13,643 0 1 1 45 46 Earnings per share 5.19 3.28 S 4.38 + Condensed Classified BS Common-Size BS 00 Trend Analysis BS- Financial Analysis Four Part Team Project Condensed Multi-Step Income Statement Common-Size Statement Company Name: Walmart, Inc 2020 2019 2018 | 2017 Fiscal year ended: (Sin 000s) (Most recent year) Revenues/Net Sales 2.1% 1.9% 4.1% 1.0% SO SO ISO SO Cost of Revenues / Cost of goods sold 0.0% 0.0% 0.0% 0.0% Gross margin 24.7% 25.1% 25.4% 25.7% SO SO SO Operating expenses 2.7% 2.2% 2.6% 3.6% SO SO Income from operations -12.3% 35.8% -28.0% -6.6% SO Other revenues and expenses 0.0% 0.0% 0.0% 0.0% S SO $ 0 + Common-Size BS - Trend Analysis BS- Condensed Multi-Step IS- Income from operation -12.3% 35.8% -28.0% -6.6% So So Other revenues and expenses 0.0% 0.0% 0.0% 0.0% Income before income tax 0.2% 91.1% -47.5% -7.3% Income tax expense 0.0% 0.0% 0.0% 0.0% SO Income before nonrecurring items 0.0% 0.0% 0.0% 0.0% SO Nonrecurring items 0.0% 0.0% 0.0% 0.0% Net income 2.8% 1.3% 2.0% 2.8% + E Common-Size BS Trend Analysis BS- Condensed Multi-Step IS Financial Analysis Four Part Team Project Condensed Multi-Step Income Statement Trend Analysis Company Name: _Walmart, Inc 2020 2019 2018 2017 Fiscal year ended: (S in 000) (Most recent year) S 520 S 510 S 496 S 481 Net Sales 108.0% 106.0% 103.0% 100 S 395 S 385 S 373 S 361 Cost of goods sold 109.2% 106.7% 103.4% 100 S 129 S 129 S 127 S 125 Gross margin 103.8% 103.6% 101.9% 100 le 10 S 136 S 480 $ 463 Operating expenses 29.4% 106.3% 103.6% 100 S 21 S 22 S 20 Income from operation: 26.0% 100.6% 107.4% 100 So SO SO Other revenues and expenses 0.0% 0.0% 0.0% 100 $ 20,116 S 11,460 S 15.123 S 20,497 Income before income tax 98.1% 55.9% 73.8% 100 + Trend Analysis BS Condensed Multi-Step Is Common-Size IS C D E F S 20.116 S 11,460 S 15,123 S 20,497 Income before income tax 98.1% 55.9% 73.8% 100 Income tax expense 0.0% 0.0% 0.0% 100 Income before nonrecurring items 0.0% 0.0% 0.0% 100 Nonrecurring items 0.0% 0.0% 0.0% 100 S 6,670 S 9,862 S 13,643 S 14,881 109.1% Net income 48.9% 72.3% 100 $ 2.26 S 3.28 Earnings per share 118.5% 51.6% 74.9% 100 Trend Analysis BS Condensed Multi-Step Is Common-Size IS Tren Financial Analysis Four Part Team Project Condensed Statement of Cash Flows Company Name: Walmart, Inc 2020 2019 2018 2017 (Most recent year) S 25,255 S 27,753 S 28,337 S 31,673 Fiscal year ended: (S in 000s) Net cash inflows (outflows) from operating activities Net cash inflows (outflows) from investing activities (9,128) S (24,036) S (9,079) S (13,896) Net cash inflows (outflows) from financing activities S (14,299) $ (2,537) S (19,875) S (19,072) Effect of exchange rate on cash Net change in cash equivalents Cash equivalents at year start + Condensed Multi-Stop IS common-Size IS Trend Analysis IS Financial Analysis Four Part Team Project Ratio Analysis Worksheet Company Name: _Walmart, Inc SIC # 2020 2019 2018 Fiscal year ended: (S in 000s) Industry Average (Most recent year) 1. Current ratio 0.8% 0.8% 0.8% 2. Acid-test ratio (Quick ratio) 3. Inventory Turnover 4. Accounts receivable turnover 5. Days' sales in receivables 6. Debt ratio 0.8% 0.6% 0.5% 7. Times-interest-earned ratio 8. Return on sales + E Common-Size IS - Trend Analysis IS- Condensed Statement of CF AB turnover 5. Days' sales in receivables 6. Debt ratio 0.8% 0.6% 0.5% 7. Times-interest-earned ratio 32 8. Return on sales 9. Return on assets 19 10 Return on common stockholders' 11. Earnings per share of common stock 12 Price/earnings 13 Dividends yield 50 14 Book value per shar of common stock + Common-Size IS - Trend Analysis IS - Condensed Statement of 3. Submit at least a one page written analysis for each financial statement. The report should be well written using appropriate business/accounting vocabulary. Comment on significant amounts, trends an relationships. When appropriate, reference amounts from the common-size statements and trend analyses. The report should be typed and double-spaced. Financial Analysis Four Part Team Project Condensed Classified Balance Sheet Company Name: Walmart, Inc Dated: 2020 2019 2018 2017 ($ in 000) (Most recent year) Current assets 61,806 $ 61,897 $ 59,664 $ 57,689 Property, plant and equiptment, net 104,317 $ 107,675 $ 107,710 Other assets 174,689 57,398 S 144,858 S 141,136 TOTAL assets $ 341,703s 323,612 312,197 S 306,535 Current liabilities $ 77,790 $ 77,477 $ 78,521 $ 66,928 Instructions Condensed Classified BS Common-Size BS- Trend Ana TAL assets $ 341,703 $ 323,612 S 312,197 $ 306,535 rrent liabilities $ 77,790 $ 77,477 S 78,521 $ 66,928 ng-term liabilities $ 77,153 $ 62,184 $ 45,179 $ 51,362 ntributed Capital $ 284 $ 288 S 295 $ 305 mained earnings $ 83,943 $ 80,785 S 85,107 89,354 easury stock and ner stockholders' nity $ 81,552 $ 79,634 S 80,822 80,535 320,722 $ 300,368 S 289,924 S 288,484 OTAL liabilities and $ ckholders' equity Instructions Condensed Classified BS Common-Size BS- Financial Analysis Four Part Team Project Condensed Classified Balance Sheet Common-Size Statements Company Name: Walmart, Inc Dated: 2020 2019 2018 2017 Sin 000s) (Most recent year) Current assets 26.1% 28.2% 29.2% 29.0% SO roperty, plant and quiptment, net 44.50% 50.8% 52.7% 54.2% Other assets 7.0% 6.8% 5.8% 5.0% S1 TOTAL assets 100.0% 100.0% 100.0% 100.0% 78% 86% 88% 88% Current liabilities 0.8% 0.8% 0.8% 0.9% ono-term liabilities 0.3% 1 30% Instructions Condensed Classified BS Common-Size BS Trend E F G H so SO 0.8% Current liabilities 0.8% 0.8% 0.9 0.9 Long-term liabilities 0.3% 0.3% 0.2% 0.3 so Contributed Capital 0.0% 0.0% 0.0% 0.0 SO Retained earnings 0.0% 0.0% 0.0% 0.0 So S 0 S 0 Treasury stock and other stockholders' equity 0.0% 0.0% 0.0% 100.0% 100.0% 100.0% 100.0 TOTAL liabilities and stockholders' equity 1% 1.0% 1.1% Condensed Classified BS- Common-Size BS Trend Analys Financial Analysis Four Part Team Project Condensed Classified Balance Sheet Trend Analysis Company Name: Walmart, Inc Dated: 2020 2019 2018 2017 (S in 000s) (Most recent year) S 61,806 S 61,897 S 59,664 S 57,689 Current assets 107.1% 107.3% 103.4% 100 $ 105,208 S 104,317 S 107,710 Property, plant and equipment, net S 107,675 100.0% 97.7% 96.8% 100 S 157,398 S 141,136 S 174,689 123.8% S 144,858 102.6% Other assets 111.5% 100 S 341,703 S 323,612 S 306,535 S 312,197 101.8% TOTAL assets 111.5% 105.6% 100 s 77,790 $ 77,477 S 78,521 S 66,928 Current liabilities 116.2% 115.8% 117.3% 100 S 77,153 S 62,184 51,362 S 45,179 E88 0% Long-term liabilities 150.2% 121.1% 100 + Condensed Classified BS Common-Size BS Trend Analysis BS S 77,790 S 78,521 $ 66,928 $ 77,477 115.8% Current liabilities 116.2% 117.3% 100 S 77,153 S 62,184 S 45,179 S 51,362 Long-term liabilities 150.2% 121.1% 88.0% 100 S 284 S 288 S 295 S 305 Contributed Capital 93.1% 94.4% 96.7% 100 S 83,943 S 80,785 S 85,107 $ 89,354 Retained earnings 93.9% 90.4% 95.2% 100 S 81,552 $ 79,634 S 80.822 S 80,535 Treasury stock and other stockholders' equity 101.3% 98.9% 100.4% 100 S 320,722 S 300,368 S 288,484 TOTAL liabilities and stockholders' S 289,924 100.5% 111.2% 104.1% 100 equity + - Condensed Classified BS Common-Size BS Trend Analysis BS Financial Analysis Four Part Team Project Condensed Multi-Step Income Statement Company Name: _ Walmart, Inc 2020 2019 2018 2017 Fiscal year ended: (S in 000) (Most recent year) Revenues / Net Sales S 141,671 S 514 $ 500 S 486 s Cost of revenues / Cost of goods sold 394,605 S 385,301 S 373,396 S 361,256 Gross margin 129 $ 129 127 $ 125 Operating expenses 136 $ 492 S 480 S 463 Income from operation S 5 S S 22 S 20 Other revenues and expenses Income before income is 20,116 $ 11,460 s 15.123 S 20,497 + Condensed Classified BS- Common-Size BS Trend Analysi C D G 480 H S 20 Operating expenses S 136 463 23 Income from operations $ 22 24 25 26 Other revenues and expenses 27 28 29 30 Income before income $ 20,116 $ 11,460 S 15,123 S 20,497 32 Income tax expense 33 35 Income before nonrecurring items 36 N 38 Nonrecurring items / / / 41 Net income G 9,862 13,643 0 1 1 45 46 Earnings per share 5.19 3.28 S 4.38 + Condensed Classified BS Common-Size BS 00 Trend Analysis BS- Financial Analysis Four Part Team Project Condensed Multi-Step Income Statement Common-Size Statement Company Name: Walmart, Inc 2020 2019 2018 | 2017 Fiscal year ended: (Sin 000s) (Most recent year) Revenues/Net Sales 2.1% 1.9% 4.1% 1.0% SO SO ISO SO Cost of Revenues / Cost of goods sold 0.0% 0.0% 0.0% 0.0% Gross margin 24.7% 25.1% 25.4% 25.7% SO SO SO Operating expenses 2.7% 2.2% 2.6% 3.6% SO SO Income from operations -12.3% 35.8% -28.0% -6.6% SO Other revenues and expenses 0.0% 0.0% 0.0% 0.0% S SO $ 0 + Common-Size BS - Trend Analysis BS- Condensed Multi-Step IS- Income from operation -12.3% 35.8% -28.0% -6.6% So So Other revenues and expenses 0.0% 0.0% 0.0% 0.0% Income before income tax 0.2% 91.1% -47.5% -7.3% Income tax expense 0.0% 0.0% 0.0% 0.0% SO Income before nonrecurring items 0.0% 0.0% 0.0% 0.0% SO Nonrecurring items 0.0% 0.0% 0.0% 0.0% Net income 2.8% 1.3% 2.0% 2.8% + E Common-Size BS Trend Analysis BS- Condensed Multi-Step IS Financial Analysis Four Part Team Project Condensed Multi-Step Income Statement Trend Analysis Company Name: _Walmart, Inc 2020 2019 2018 2017 Fiscal year ended: (S in 000) (Most recent year) S 520 S 510 S 496 S 481 Net Sales 108.0% 106.0% 103.0% 100 S 395 S 385 S 373 S 361 Cost of goods sold 109.2% 106.7% 103.4% 100 S 129 S 129 S 127 S 125 Gross margin 103.8% 103.6% 101.9% 100 le 10 S 136 S 480 $ 463 Operating expenses 29.4% 106.3% 103.6% 100 S 21 S 22 S 20 Income from operation: 26.0% 100.6% 107.4% 100 So SO SO Other revenues and expenses 0.0% 0.0% 0.0% 100 $ 20,116 S 11,460 S 15.123 S 20,497 Income before income tax 98.1% 55.9% 73.8% 100 + Trend Analysis BS Condensed Multi-Step Is Common-Size IS C D E F S 20.116 S 11,460 S 15,123 S 20,497 Income before income tax 98.1% 55.9% 73.8% 100 Income tax expense 0.0% 0.0% 0.0% 100 Income before nonrecurring items 0.0% 0.0% 0.0% 100 Nonrecurring items 0.0% 0.0% 0.0% 100 S 6,670 S 9,862 S 13,643 S 14,881 109.1% Net income 48.9% 72.3% 100 $ 2.26 S 3.28 Earnings per share 118.5% 51.6% 74.9% 100 Trend Analysis BS Condensed Multi-Step Is Common-Size IS Tren Financial Analysis Four Part Team Project Condensed Statement of Cash Flows Company Name: Walmart, Inc 2020 2019 2018 2017 (Most recent year) S 25,255 S 27,753 S 28,337 S 31,673 Fiscal year ended: (S in 000s) Net cash inflows (outflows) from operating activities Net cash inflows (outflows) from investing activities (9,128) S (24,036) S (9,079) S (13,896) Net cash inflows (outflows) from financing activities S (14,299) $ (2,537) S (19,875) S (19,072) Effect of exchange rate on cash Net change in cash equivalents Cash equivalents at year start + Condensed Multi-Stop IS common-Size IS Trend Analysis IS Financial Analysis Four Part Team Project Ratio Analysis Worksheet Company Name: _Walmart, Inc SIC # 2020 2019 2018 Fiscal year ended: (S in 000s) Industry Average (Most recent year) 1. Current ratio 0.8% 0.8% 0.8% 2. Acid-test ratio (Quick ratio) 3. Inventory Turnover 4. Accounts receivable turnover 5. Days' sales in receivables 6. Debt ratio 0.8% 0.6% 0.5% 7. Times-interest-earned ratio 8. Return on sales + E Common-Size IS - Trend Analysis IS- Condensed Statement of CF AB turnover 5. Days' sales in receivables 6. Debt ratio 0.8% 0.6% 0.5% 7. Times-interest-earned ratio 32 8. Return on sales 9. Return on assets 19 10 Return on common stockholders' 11. Earnings per share of common stock 12 Price/earnings 13 Dividends yield 50 14 Book value per shar of common stock + Common-Size IS - Trend Analysis IS - Condensed Statement of
Step by Step Solution
There are 3 Steps involved in it

Get step-by-step solutions from verified subject matter experts