

Question: #3: The Ants go Marching One Thousand by One Thousand, Hurrah, Hurrah! Consider the table that shows Year (x) and the number of ants in
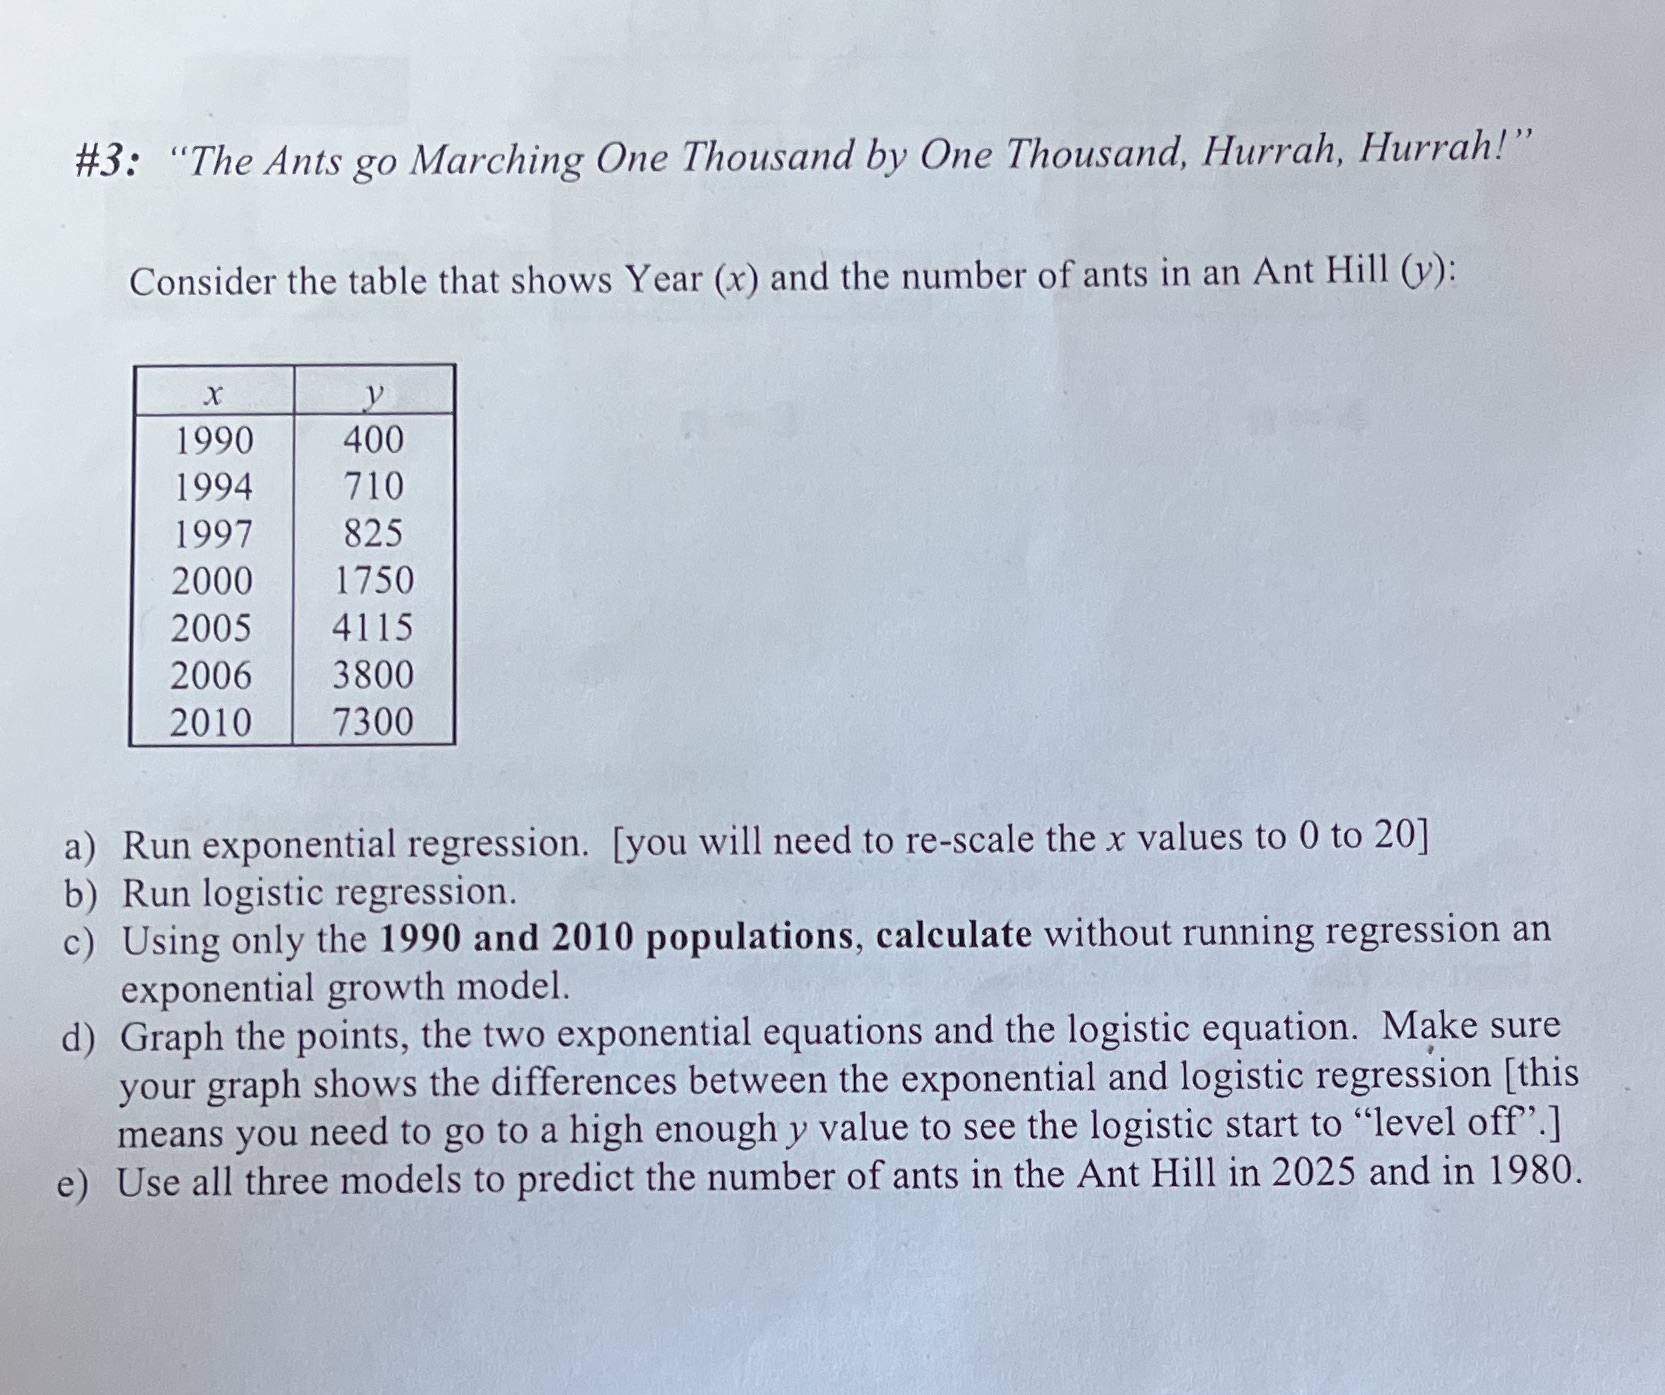
#3: "The Ants go Marching One Thousand by One Thousand, Hurrah, Hurrah!" Consider the table that shows Year (x) and the number of ants in an Ant Hill (y): x 1990 400 1994 710 1997 825 2000 1750 2005 4115 2006 3800 2010 7300 a) Run exponential regression. [you will need to re-scale the x values to 0 to 20] b) Run logistic regression. c) Using only the 1990 and 2010 populations, calculate without running regression an exponential growth model. d) Graph the points, the two exponential equations and the logistic equation. Make sure your graph shows the differences between the exponential and logistic regression [ this means you need to go to a high enough y value to see the logistic start to "level off'.] e) Use all three models to predict the number of ants in the Ant Hill in 2025 and in 1980
Step by Step Solution
There are 3 Steps involved in it

Get step-by-step solutions from verified subject matter experts