

Question: 3. The box plot shown below represent the battery life (in hours) of two brand of laptops. The data represent the results of testing 120
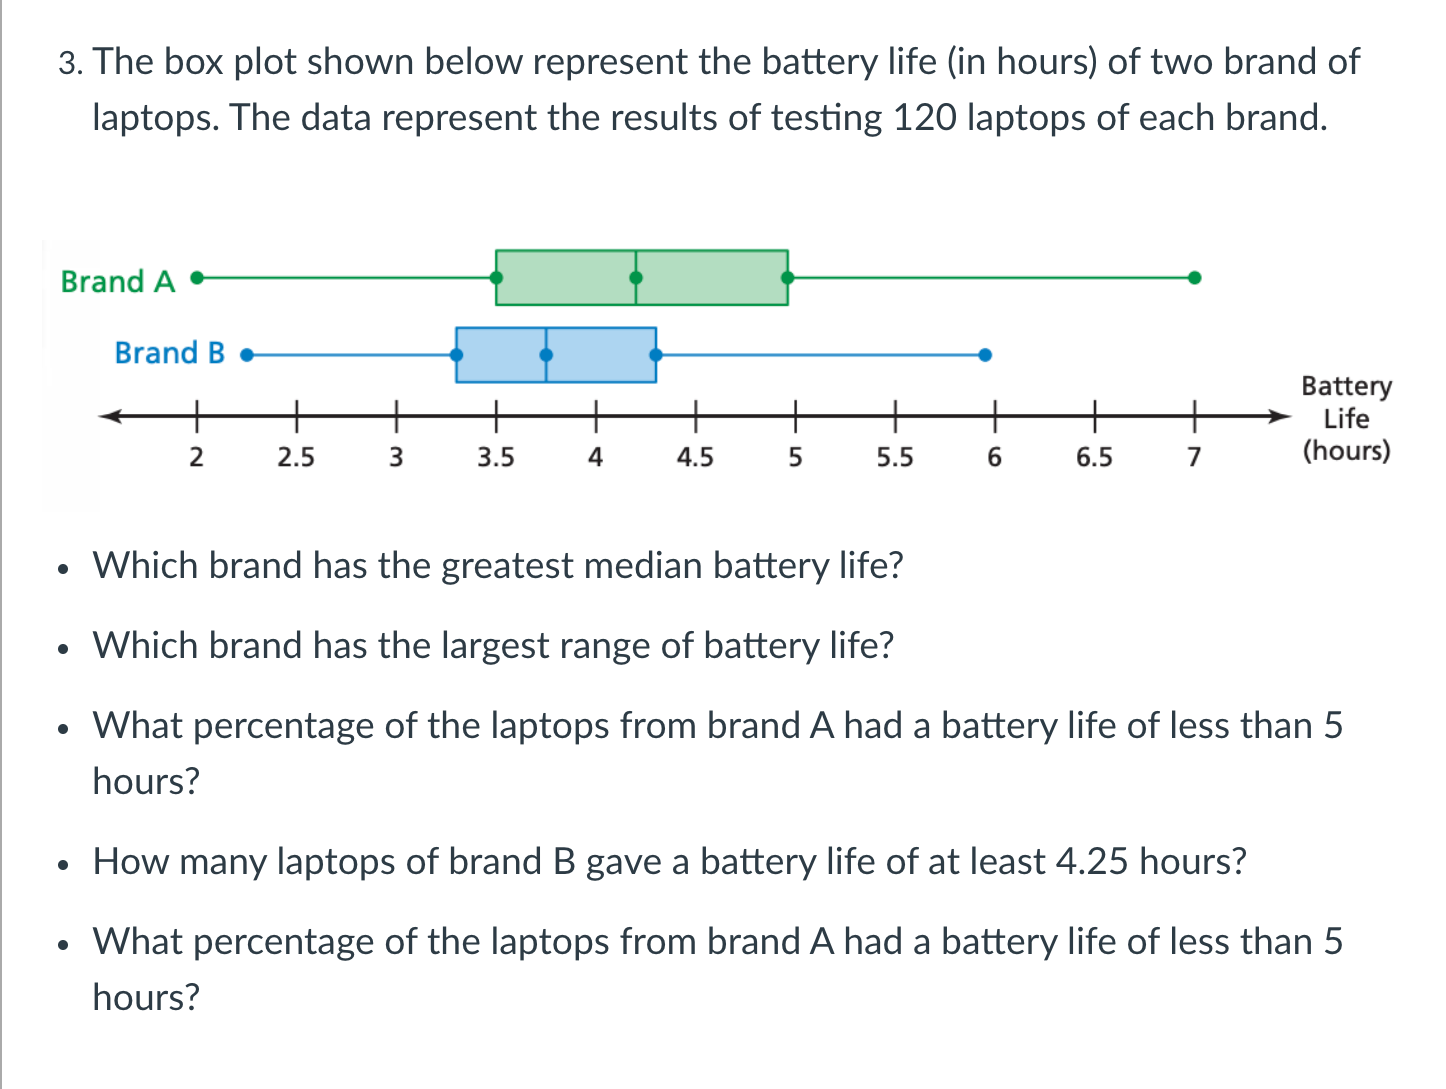
3. The box plot shown below represent the battery life (in hours) of two brand of laptops. The data represent the results of testing 120 laptops of each brand. . Which brand has the greatest median battery life? . Which brand has the largest range of battery life? . What percentage of the laptops from brand A had a battery life of less than 5 hours? - How many laptops of brand B gave a battery life of at least 4.25 hours? - What percentage of the laptops from brand A had a battery life of less than 5 hours
Step by Step Solution
There are 3 Steps involved in it
1 Expert Approved Answer
Step: 1 Unlock

Question Has Been Solved by an Expert!
Get step-by-step solutions from verified subject matter experts
Step: 2 Unlock
Step: 3 Unlock