

Question: 3. The data is also represented in the histogram below. Use the histogram to complete the table. 4. Use the information in the table to
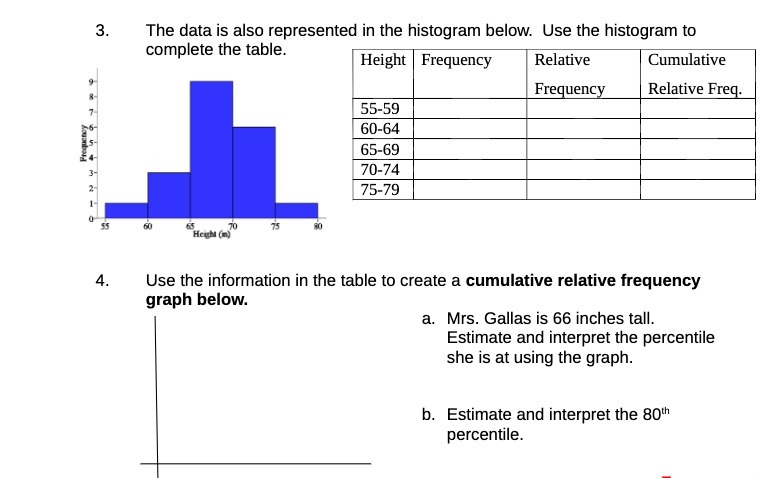
3. The data is also represented in the histogram below. Use the histogram to complete the table. 4. Use the information in the table to create a cumulative relative frequencyr graph below. a. Mrs. Gallas is 66 inches tall. Estimate and interpret the percentile she is at using the graph. [1. Estimate and interpret the 30\"\" percentile
Step by Step Solution
There are 3 Steps involved in it
1 Expert Approved Answer
Step: 1 Unlock

Question Has Been Solved by an Expert!
Get step-by-step solutions from verified subject matter experts
Step: 2 Unlock
Step: 3 Unlock