

Question: 3. The figure below shows a Beer's Law plot for the absorbance of 5 different known solutions CH2 of crystal violet along with the equation
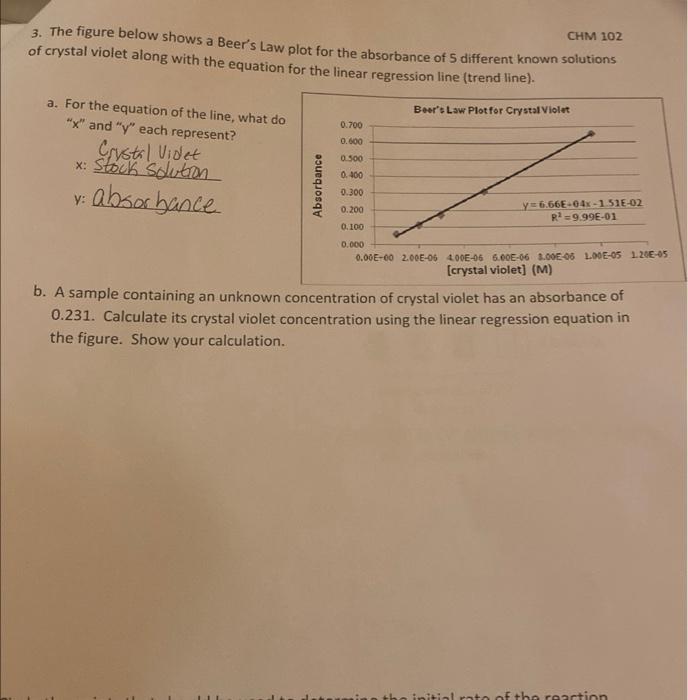
3. The figure below shows a Beer's Law plot for the absorbance of 5 different known solutions CH2 of crystal violet along with the equation for the linear regression line (trend line). a. For the equation of the line, what do " x " and " y " each represent? x: Stock solivtion x: Stock solition y: absor bance b. A sample containing an unknown concentration of crystal violet has an absorbance of 0.231. Calculate its crystal violet concentration using the linear regression equation in the figure. Show your calculation
Step by Step Solution
There are 3 Steps involved in it
1 Expert Approved Answer
Step: 1 Unlock

Question Has Been Solved by an Expert!
Get step-by-step solutions from verified subject matter experts
Step: 2 Unlock
Step: 3 Unlock