

Question: 3. The figures below ( A and B ) represent different atmospheric situations in Madrid: a) According to figures A) and B) discuss the atmospheric
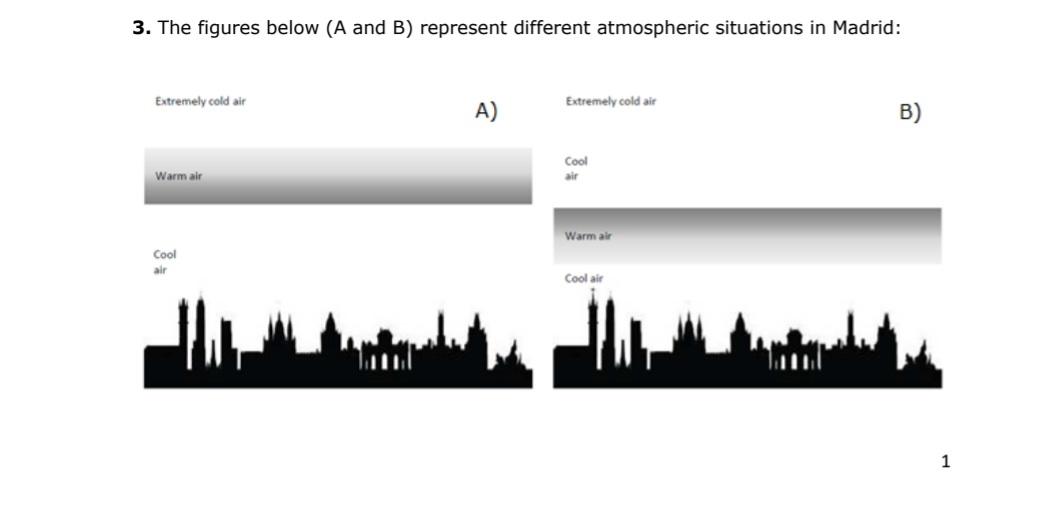
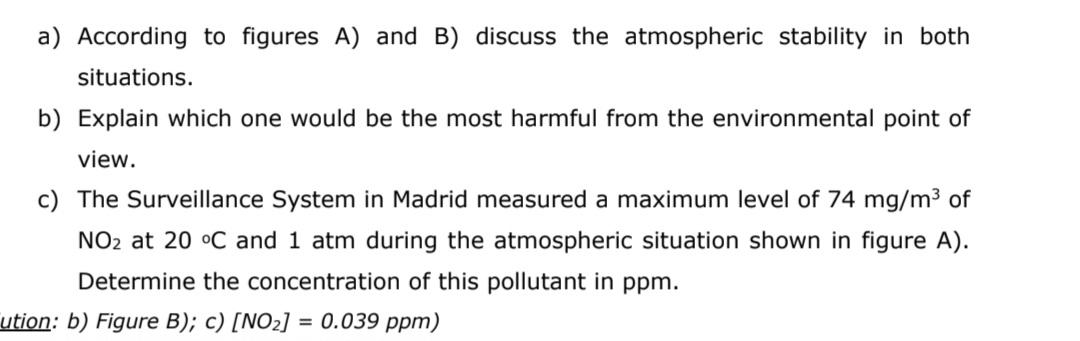
3. The figures below ( A and B ) represent different atmospheric situations in Madrid: a) According to figures A) and B) discuss the atmospheric stability in both situations. b) Explain which one would be the most harmful from the environmental point of view. c) The Surveillance System in Madrid measured a maximum level of 74mg/m3 of NO2 at 20C and 1 atm during the atmospheric situation shown in figure A ). Determine the concentration of this pollutant in ppm. tion: b) Figure B); c) [NO2]=0.039ppm )
Step by Step Solution
There are 3 Steps involved in it
1 Expert Approved Answer
Step: 1 Unlock

Question Has Been Solved by an Expert!
Get step-by-step solutions from verified subject matter experts
Step: 2 Unlock
Step: 3 Unlock