

Question: 3 The graph below shows v x versus t for an object moving along a straight line. How would you find the displacement x of
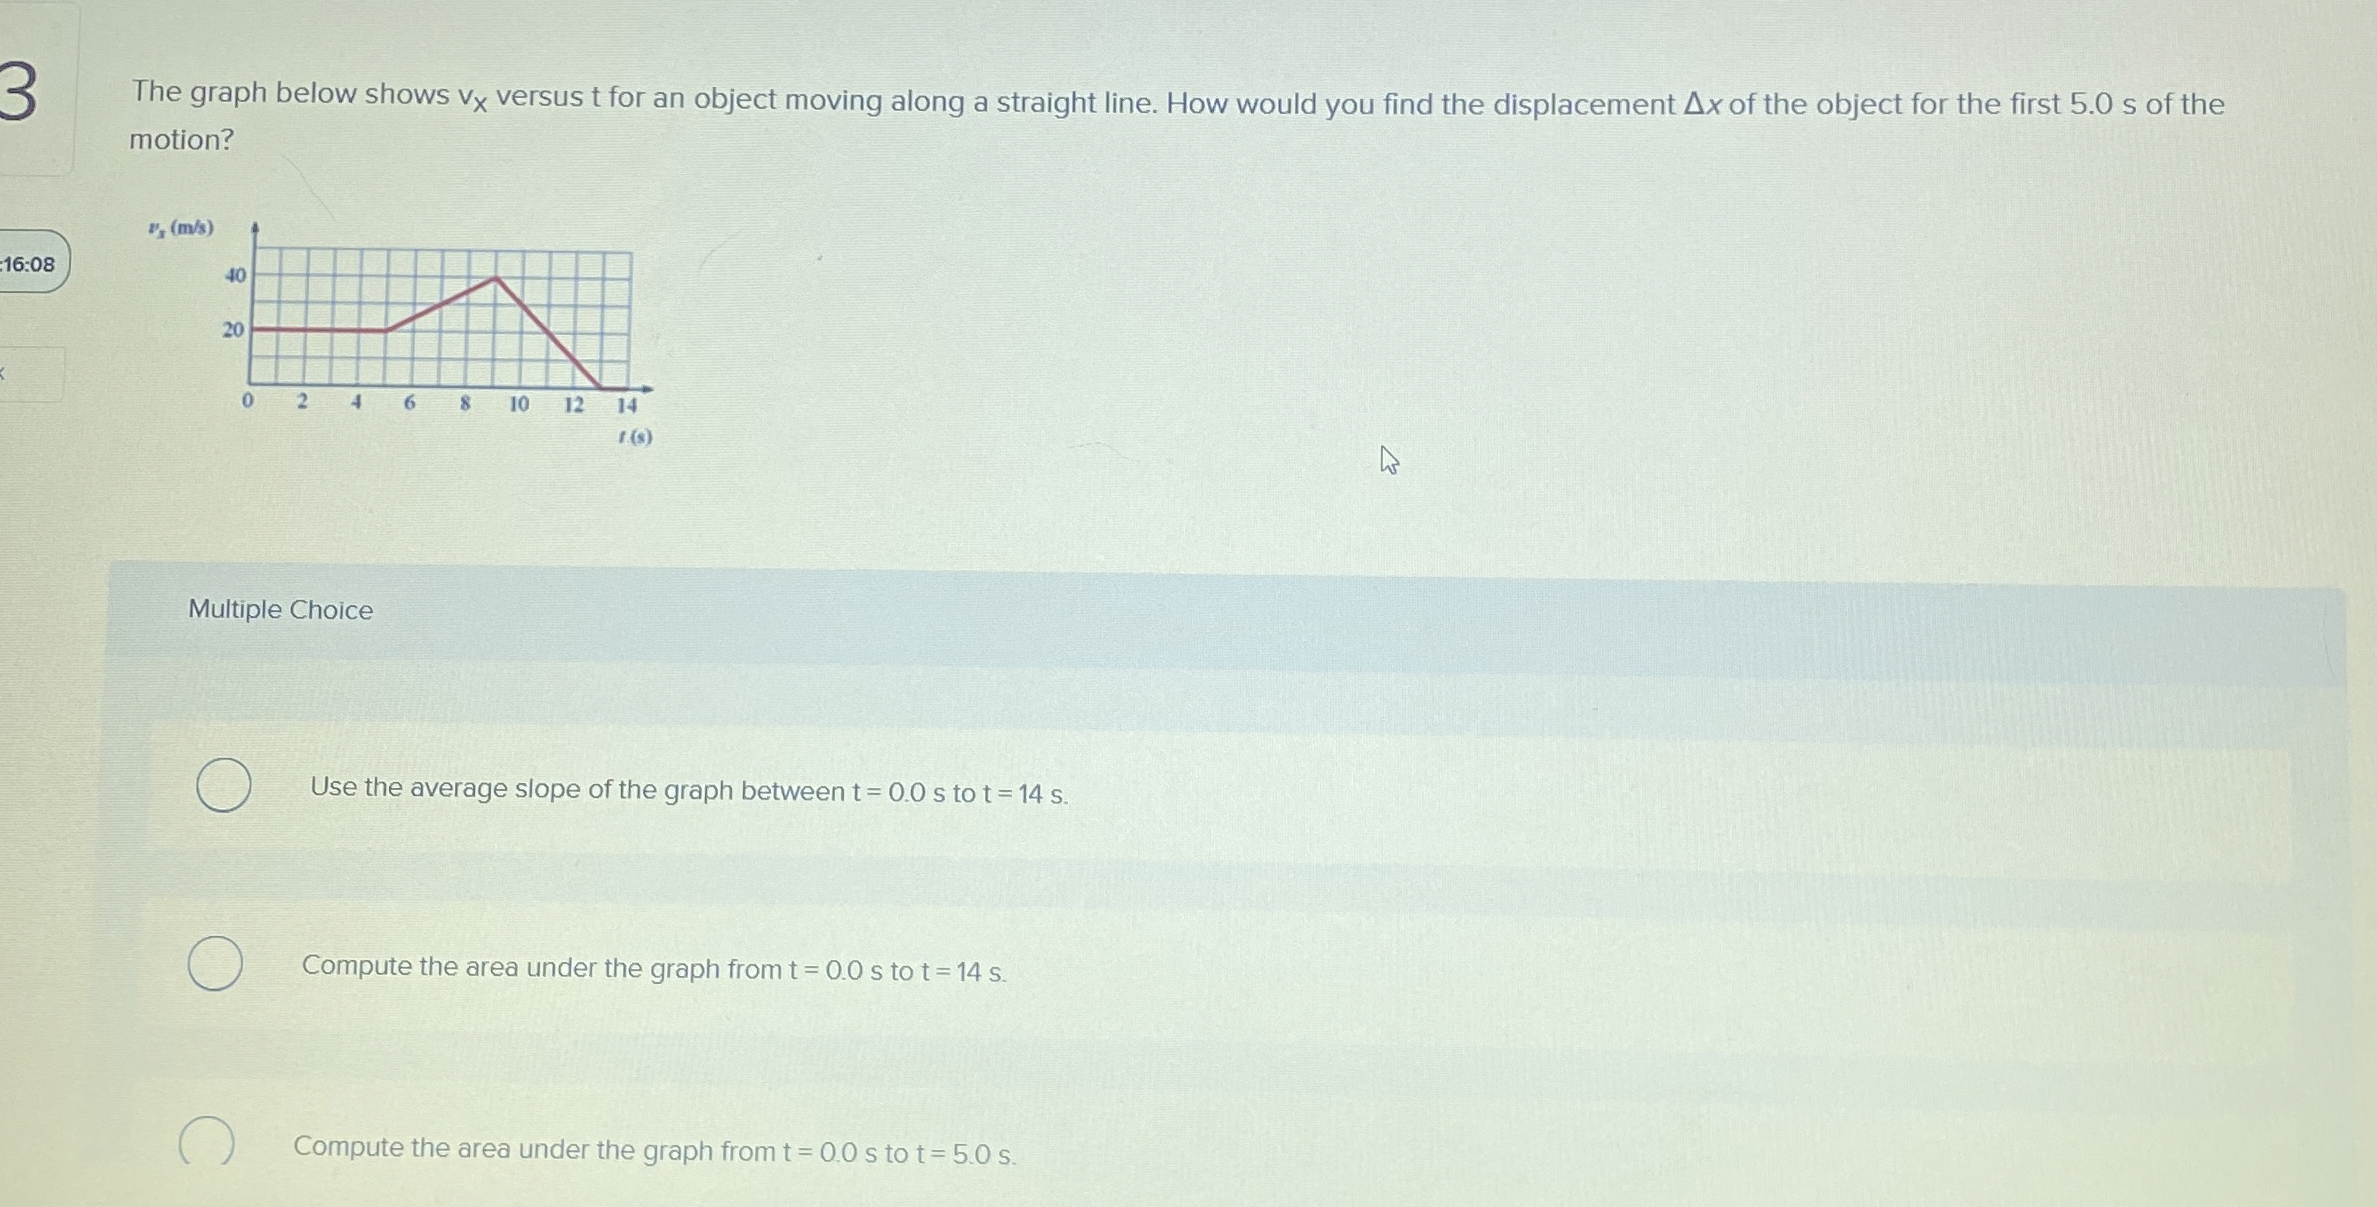
The graph below shows versus for an object moving along a straight line. How would you find the displacement of the object for the first s of the motion?
:
Multiple Choice
Use the average slope of the graph between to
Compute the area under the graph from to
Compute the area under the graph from to
Step by Step Solution
There are 3 Steps involved in it
1 Expert Approved Answer
Step: 1 Unlock

Question Has Been Solved by an Expert!
Get step-by-step solutions from verified subject matter experts
Step: 2 Unlock
Step: 3 Unlock