

Question: 3 . The graph of function ( F ) shows the approximate weekly revenues ( y ) of your company from
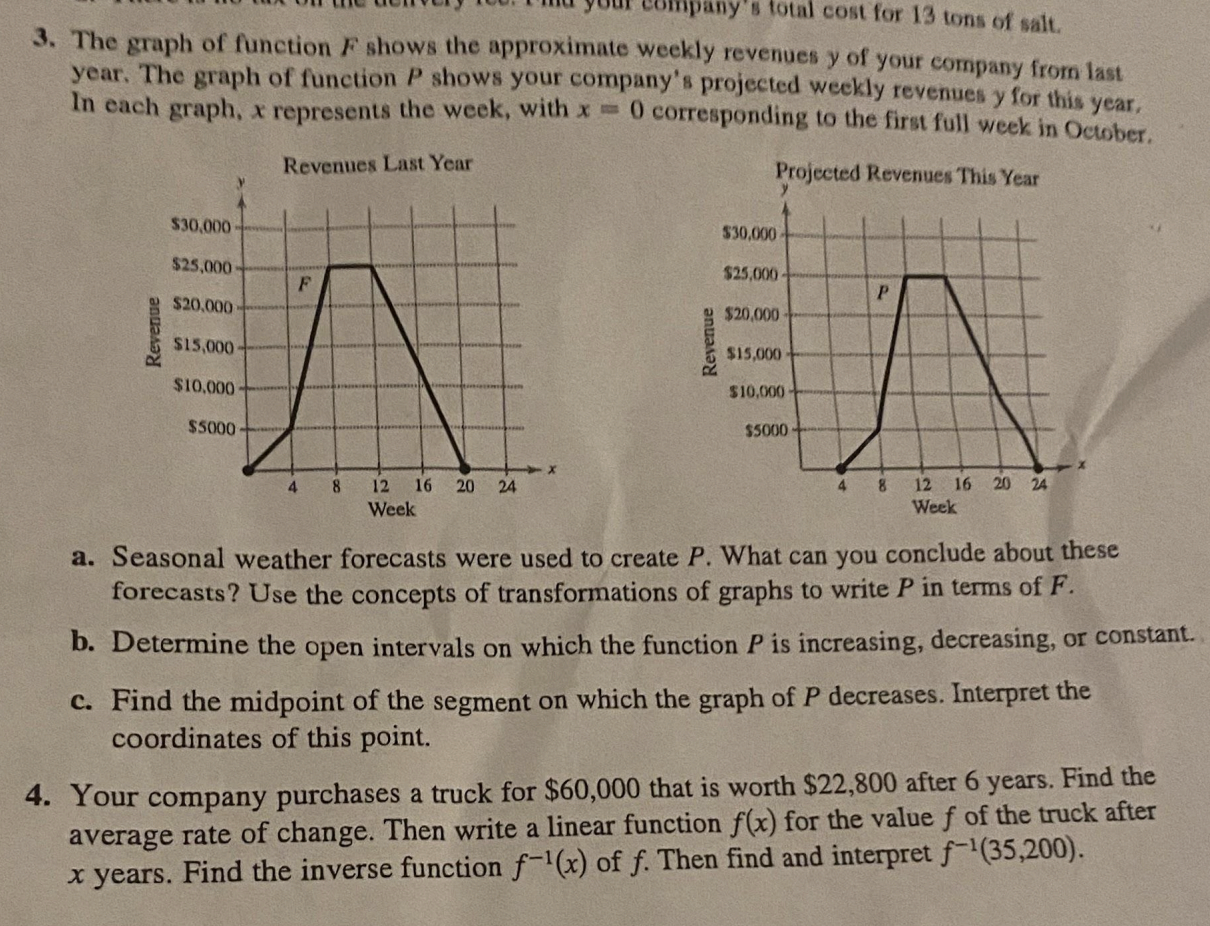
The graph of function F shows the approximate weekly revenues y of your company from last year. The graph of function P shows your company's projected weekly revenues y for this year, In each graph, x represents the week, with x corresponding to the first full week in October. a Seasonal weather forecasts were used to create P What can you conclude about these forecasts? Use the concepts of transformations of graphs to write P in terms of F b Determine the open intervals on which the function P is increasing, decreasing, or constant. c Find the midpoint of the segment on which the graph of P decreases. Interpret the coordinates of this point. Your company purchases a truck for $ that is worth $ after years. Find the average rate of change. Then write a linear function fx for the value f of the truck after x years. Find the inverse function fx of f Then find and interpret f
Step by Step Solution
There are 3 Steps involved in it
1 Expert Approved Answer
Step: 1 Unlock

Question Has Been Solved by an Expert!
Get step-by-step solutions from verified subject matter experts
Step: 2 Unlock
Step: 3 Unlock