

Question: 3. The normal line loading data and the bus short circuit data are shown below for a radial system protected by type i fuses. Determine
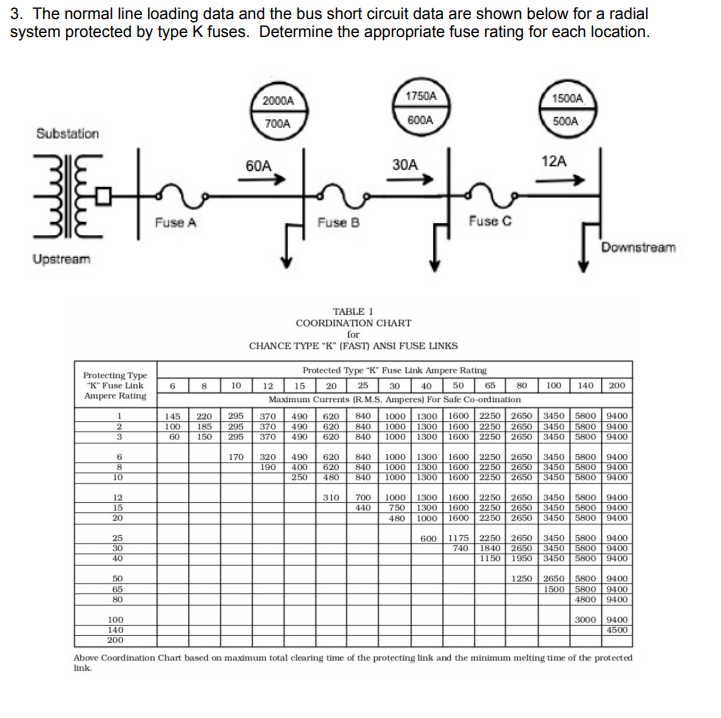
3. The normal line loading data and the bus short circuit data are shown below for a radial system protected by type i fuses. Determine the appropriate fuse rating for each location. 2000A 700A 1750A 600A 1500A 500A Substation 60A 30A 12A Fuse A Fuse B Fuse C Downstream Upstream for Protecting Type "K" Fuse Link Ampere Rating 6 8 10 200 145 295 1 2 3 TABLE 1 COORDINATION CHART CHANCE TYPE "K" (FAST) ANSI FUSE LINKS Protected Type "K" Fuse Link Ampere Rating 1215 20 25 30 40 50 65 80 100 140 Maximum Currents (R.M.S. Amperes) For Sale Co-ordination 370 490 620 8-10 1000 1300 1600 2250 2650 3450 5800 9400 370 490 620 840 1000 1300 1600 2250 2650 3450 5800 9400 370 490 620 840 1000 1300 1600 2250 2650 3450 5800 SM00 320 490 620 8440 1000 1300 1600 2250 2650 3450 5800 9400 190 400 620 840 1000 1300 1600 2250 2650 3450 5800 9400 250 480 840 1000 1300 1600 2250 2650 3450 5800 9400 310 700 1000 1300 1600 2250 26.50 3450 5800 9400 440 750 1300 1600 2250 2650 3450 5800 9400 480 1000 1600 2250 2650 3450 580000 220 185 150 100 60 295 170 6 8 10 12 15 20 600 25 30 40 1175 2250 2650 3450 5800 9400 1840 2650 3450 5800 9400 1150 1950 34505800 9400 740 50 65 80 12550 2650 1500 5800 9400 5800 9400 4800 9400 100 140 200 3000 9400 4500 Above Coordination Chart based on maximum total clearing time of the protecting link and the minimum melting time of the protected link 3. The normal line loading data and the bus short circuit data are shown below for a radial system protected by type i fuses. Determine the appropriate fuse rating for each location. 2000A 700A 1750A 600A 1500A 500A Substation 60A 30A 12A Fuse A Fuse B Fuse C Downstream Upstream for Protecting Type "K" Fuse Link Ampere Rating 6 8 10 200 145 295 1 2 3 TABLE 1 COORDINATION CHART CHANCE TYPE "K" (FAST) ANSI FUSE LINKS Protected Type "K" Fuse Link Ampere Rating 1215 20 25 30 40 50 65 80 100 140 Maximum Currents (R.M.S. Amperes) For Sale Co-ordination 370 490 620 8-10 1000 1300 1600 2250 2650 3450 5800 9400 370 490 620 840 1000 1300 1600 2250 2650 3450 5800 9400 370 490 620 840 1000 1300 1600 2250 2650 3450 5800 SM00 320 490 620 8440 1000 1300 1600 2250 2650 3450 5800 9400 190 400 620 840 1000 1300 1600 2250 2650 3450 5800 9400 250 480 840 1000 1300 1600 2250 2650 3450 5800 9400 310 700 1000 1300 1600 2250 26.50 3450 5800 9400 440 750 1300 1600 2250 2650 3450 5800 9400 480 1000 1600 2250 2650 3450 580000 220 185 150 100 60 295 170 6 8 10 12 15 20 600 25 30 40 1175 2250 2650 3450 5800 9400 1840 2650 3450 5800 9400 1150 1950 34505800 9400 740 50 65 80 12550 2650 1500 5800 9400 5800 9400 4800 9400 100 140 200 3000 9400 4500 Above Coordination Chart based on maximum total clearing time of the protecting link and the minimum melting time of the protected link
Step by Step Solution
There are 3 Steps involved in it

Get step-by-step solutions from verified subject matter experts