

Question: 3. The plot below shows a frequency distribution in gray bars and a normal probability distribution as a red line. 0.1 10 43332D50 Frequency
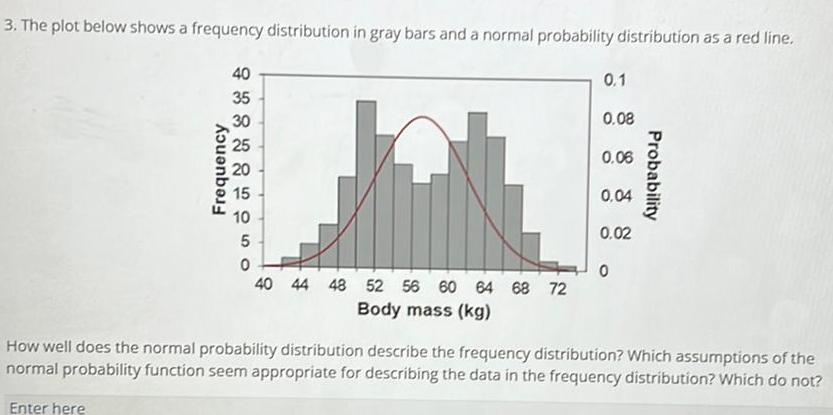
3. The plot below shows a frequency distribution in gray bars and a normal probability distribution as a red line. 0.1 10 43332D50 Frequency Probability 0.08 0.06 0,04 0.02 0 40 44 48 52 56 60 64 68 72 Body mass (kg) How well does the normal probability distribution describe the frequency distribution? Which assumptions of the normal probability function seem appropriate for describing the data in the frequency distribution? Which do not? Enter here
Step by Step Solution
There are 3 Steps involved in it
1 Expert Approved Answer
Step: 1 Unlock

Question Has Been Solved by an Expert!
Get step-by-step solutions from verified subject matter experts
Step: 2 Unlock
Step: 3 Unlock