

Question: 3. The regression analysis below considered the relationship between a country's average number of kids per adult female and the country's adult literacy rate. 110
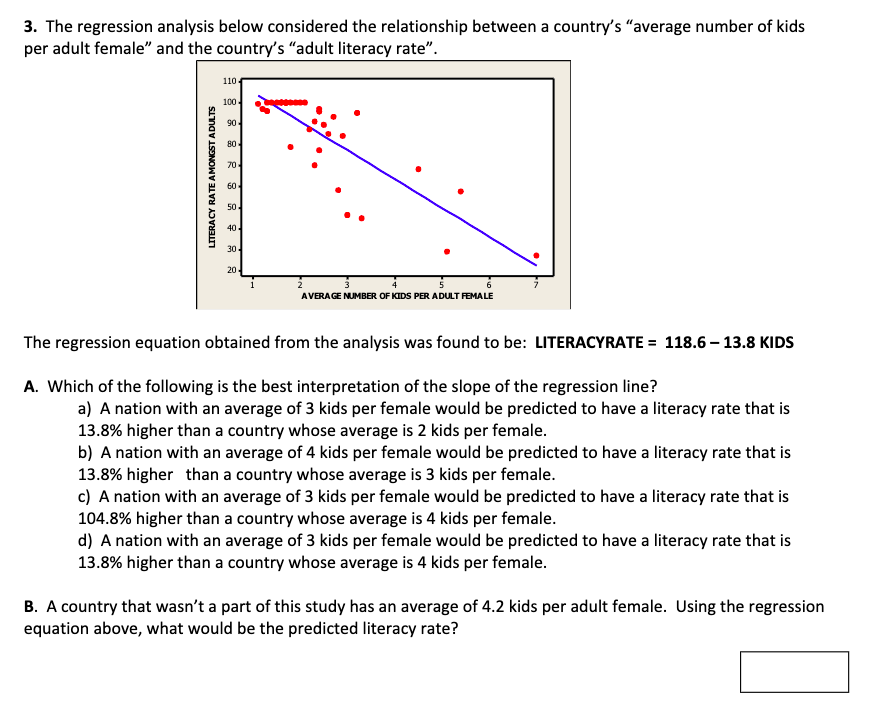


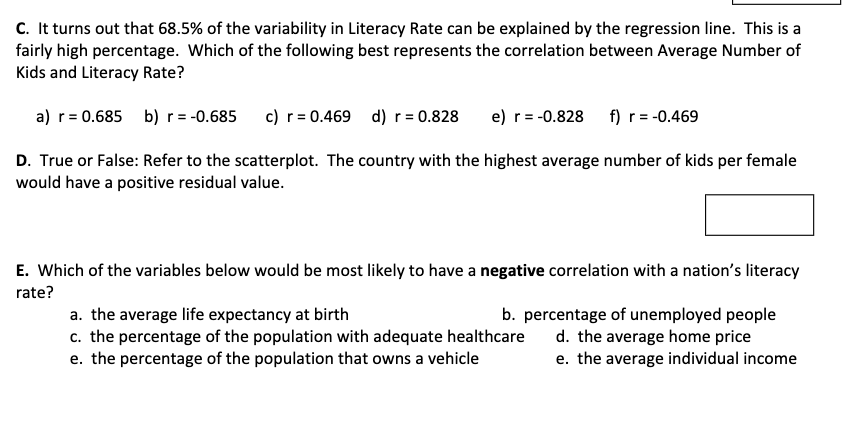
3. The regression analysis below considered the relationship between a country's "average number of kids per adult female" and the country's "adult literacy rate". 110 100 90 70 LITERACY RATE AMONGST ADULTS 50 40 30 20 AVERAGE NUMBER OF KIDS PER ADULT FEMALE The regression equation obtained from the analysis was found to be: LITERACYRATE = 118.6-13.8 KIDS A. Which of the following is the best interpretation of the slope of the regression line? a) A nation with an average of 3 kids per female would be predicted to have a literacy rate that is 13.8% higher than a country whose average is 2 kids per female. b) A nation with an average of 4 kids per female would be predicted to have a literacy rate that is 13.8% higher than a country whose average is 3 kids per female. c) A nation with an average of 3 kids per female would be predicted to have a literacy rate that is 104.8% higher than a country whose average is 4 kids per female. d) A nation with an average of 3 kids per female would be predicted to have a literacy rate that is 13.8% higher than a country whose average is 4 kids per female. B. A country that wasn't a part of this study has an average of 4.2 kids per adult female. Using the regression equation above, what would be the predicted literacy rate?C. It turns out that 68.5% of the variability in Literacy Rate can be explained by the regression line. This is a fairly high percentage. Which of the following best represents the correlation between Average Number of Kids and Literacy Rate? a) r = 0.685 b) r =-0.685 c) r = 0.469 d) r = 0.828 e) r = -0.828 f) r= -0.469 D. True or False: Refer to the scatterplot. The country with the highest average number of kids per female would have a positive residual value. E. Which of the variables below would be most likely to have a negative correlation with a nation's literacy rate? a. the average life expectancy at birth b. percentage of unemployed people c. the percentage of the population with adequate healthcare d. the average home price e. the percentage of the population that owns a vehicle e. the average individual income
Step by Step Solution
There are 3 Steps involved in it

Get step-by-step solutions from verified subject matter experts