

Question: 3 . The stress - time pattern shown in Fig. 1 is to be repeated in blocks until failure of a test component occurs. The
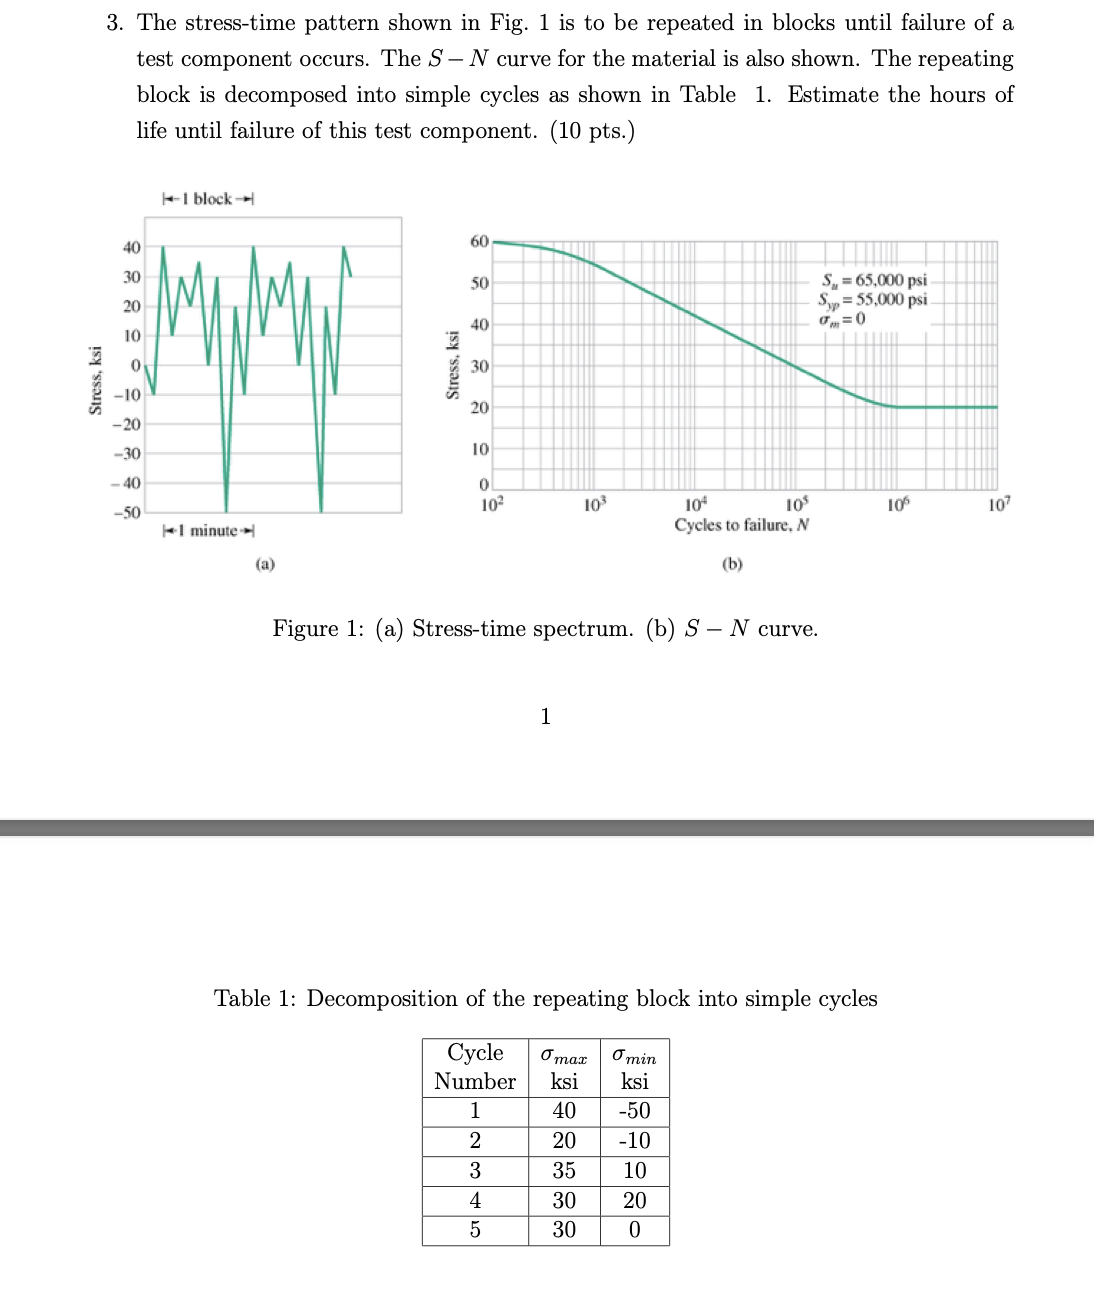
The stresstime pattern shown in Fig. is to be repeated in blocks until failure of a test component occurs. The SN curve for the material is also shown. The repeating block is decomposed into simple cycles as shown in Table Estimate the hours of life until failure of this test component. pts
Figure : a Stresstime spectrum. b SN curve.
Table : Decomposition of the repeating block into simple cycles
Step by Step Solution
There are 3 Steps involved in it
1 Expert Approved Answer
Step: 1 Unlock

Question Has Been Solved by an Expert!
Get step-by-step solutions from verified subject matter experts
Step: 2 Unlock
Step: 3 Unlock