

Question: 3. The table below shows a Markov matrix for the income levels of 50 countries over two centuries: Poor in 20th CE Middle Income in
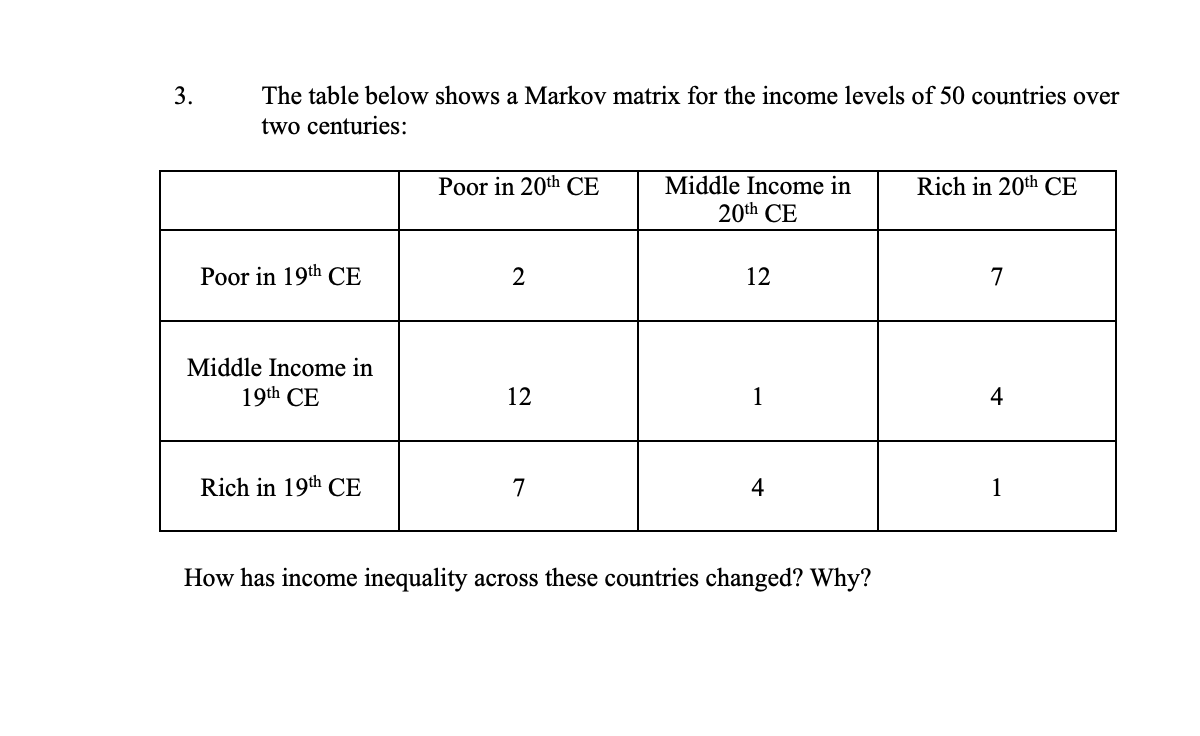

3. The table below shows a Markov matrix for the income levels of 50 countries over two centuries: Poor in 20th CE Middle Income in Rich in 20th CE 20th CE Poor in 19th CE 2 12 7 Middle Income in 19th CE 12 4 Rich in 19th CE 7 4 How has income inequality across these countries changed? Why
Step by Step Solution
There are 3 Steps involved in it
1 Expert Approved Answer
Step: 1 Unlock

Question Has Been Solved by an Expert!
Get step-by-step solutions from verified subject matter experts
Step: 2 Unlock
Step: 3 Unlock