

Question: 3. The table below shows the prot made by a company between 2001 and 2009 Year 2001 2002 2003 2004 2005 2006 2007 2008 2009
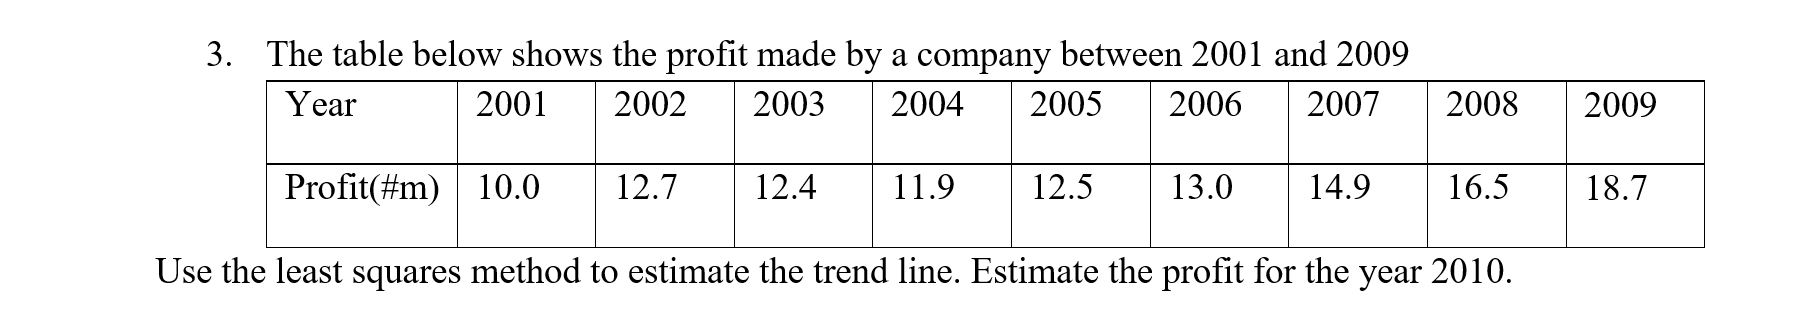

3. The table below shows the prot made by a company between 2001 and 2009 Year 2001 2002 2003 2004 2005 2006 2007 2008 2009 Prot(#m) 10.0 12.7 12.4 11.9 12.5 13.0 14.9 16.5 18.7 Use the least squares method to estimate the trend line. Estimate the prot for the year 2010
Step by Step Solution
There are 3 Steps involved in it
1 Expert Approved Answer
Step: 1 Unlock

Question Has Been Solved by an Expert!
Get step-by-step solutions from verified subject matter experts
Step: 2 Unlock
Step: 3 Unlock