

Question: 3) The table below (Table 3.1) shows data collected by measurement of the same SRM measured ten times over three different days. The sequence of
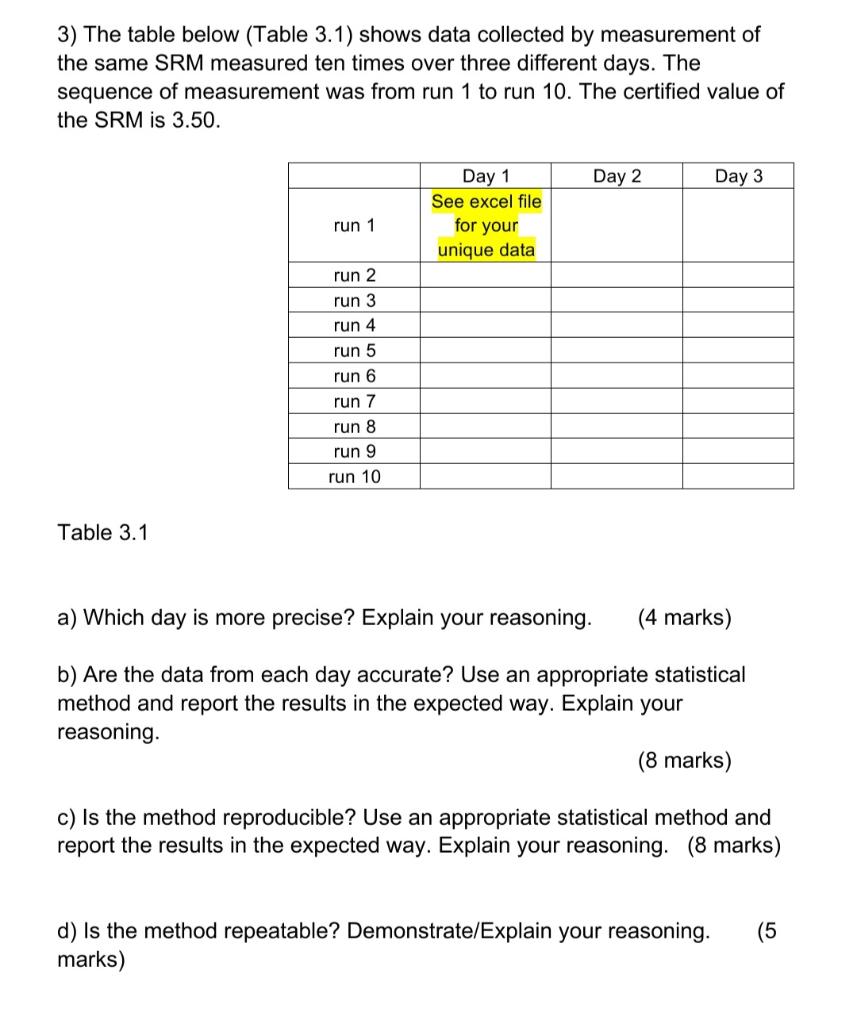
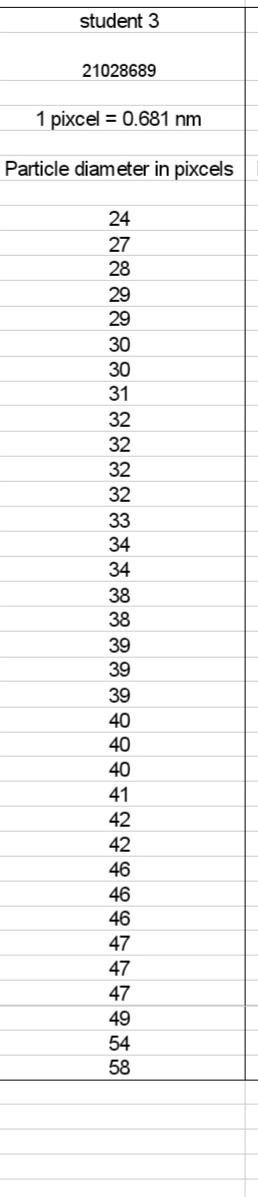
3) The table below (Table 3.1) shows data collected by measurement of the same SRM measured ten times over three different days. The sequence of measurement was from run 1 to run 10. The certified value of the SRM is 3.50. Day 2 Day 3 Day 1 See excel file run 1 for your unique data run 2 run 3 run 4 run 5 run 6 run 7 run 8 run 9 run 10 Table 3.1 a) Which day is more precise? Explain your reasoning. (4 marks) b) Are the data from each day accurate? Use an appropriate statistical method and report the results in the expected way. Explain your reasoning. (8 marks) c) is the method reproducible? Use an appropriate statistical method and report the results in the expected way. Explain your reasoning. (8 marks) (5 d) is the method repeatable? Demonstrate/Explain your reasoning. marks) student 3 21028689 1 pixcel = 0.681 nm Particle diameter pixcels 24 27 29 29 30 30 31 32 32 32 32 33 34 34 38 38 39 39 39 40 40 40 41 42 42 46 46 46 47 47 47 49 54 58
Step by Step Solution
There are 3 Steps involved in it

Get step-by-step solutions from verified subject matter experts