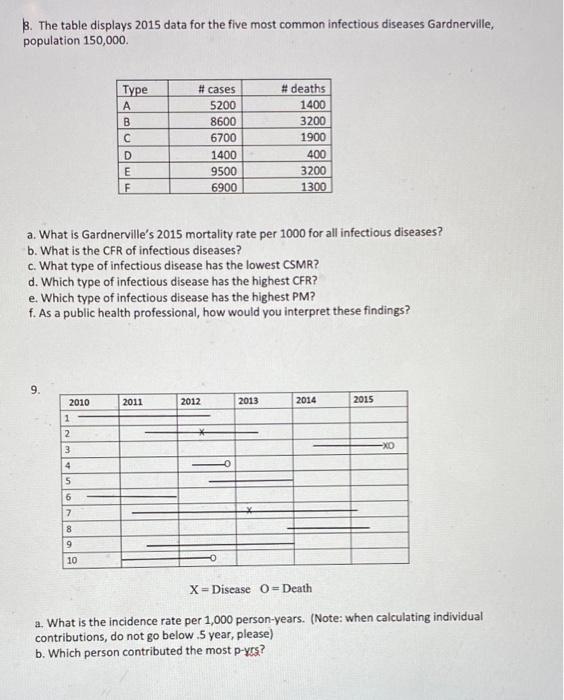
Question: 3. The table displays 2015 data for the five most common infectious diseases Gardnerville, population 150,000. 9. 2010 1 2 3 4 5 6 7

3. The table displays 2015 data for the five most
3. The table displays 2015 data for the five most common infectious diseases Gardnerville, population 150,000. 9. 2010 1 2 3 4 5 6 7 Type A B C 8 9 10 D E F a. What is Gardnerville's 2015 mortality rate per 1000 for all infectious diseases? b. What is the CFR of infectious diseases? c. What type of infectious disease has the lowest CSMR? d. Which type of infectious disease has the highest CFR? e. Which type of infectious disease has the highest PM? f. As a public health professional, how would you interpret these findings? #cases 5200 8600 6700 2011 2012 1400 9500 6900 * -0 #deaths 1400 3200 1900 400 3200 1300 2013 2014 2015 -XO X= Disease 0-Death a. What is the incidence rate per 1,000 person-years. (Note: when calculating individual contributions, do not go below .5 year, please) b. Which person contributed the most p-yrs? Please open this document. What is the incidence rate per 1,000 person-years. (Note: when calculating individual contributions, do not go below .5 year, please) Which person contributed the most p-yrs

Step by Step Solution

There are 3 Steps involved in it

1 Expert Approved Answer
Step: 1 Unlock blur-text-image
Question Has Been Solved by an Expert!

Get step-by-step solutions from verified subject matter experts

Step: 2 Unlock
Step: 3 Unlock

Students Have Also Explored These Related General Management Questions!